What Is an SEO Report?
An SEO report is basically your website’s report card—but instead of grades, it shows stuff like:
- How many people are finding you on Google (or not).
- Which keywords you’re ranking for (and which ones you’re bombing at).
- Who’s linking to your site (and whether those links are legit or sketchy).
It’s not just a bunch of numbers, though. The real magic happens when you use it to figure out *why* your traffic’s tanking or *how* to outrank that annoying competitor. Whether you’re a pro or just trying to get your biz noticed, these reports are your cheat sheet to playing the Google game without losing your mind.
Why SEO Reporting Is Important
Aligning Goals with Performance Metrics
Here’s the thing: SEO reports aren’t just about numbers. They’re about answering *“Are we hitting our goals?”* For example:
- If your goal is more sales, your report should show how much traffic comes from keywords like “affordable yoga mats” and whether those visitors are actually buying.
- If your goal is brand awareness, track rankings for terms like “best coffee in town” and see if your traffic’s growing month-over-month.
The trick is to make sure every metric ties back to a real business goal. Otherwise, you’re just collecting data for no reason. (And trust me, nobody’s got time for that.)
Building Trust and Transparency with Clients
Clients don’t care about fancy charts—they care about results. A good SEO report should:
- Show progress clearly: *“Your traffic’s up 30% since last quarter.”*
- Explain the “why”: *“We optimized your blog for ‘vegan protein powder,’ and now you’re ranking #1.”*
- Be consistent: Monthly updates keep clients in the loop and stop them from wondering what they’re paying for.
Transparency builds trust. And trust keeps clients from jumping ship. (Or worse, ghosting you.)
Driving Data-Informed SEO Strategies
SEO reports aren’t just about looking back—they’re about planning ahead. Use them to:
- Spot trends: *“Our blog posts about ‘budget travel’ are killing it. Let’s write more.”*
- Fix what’s broken: *“Our ‘luxury skincare’ page isn’t converting. Maybe it’s the 2005 design.”*
- Find new opportunities: *“Competitors are ignoring TikTok. Let’s post dance trends with our product.”*
The goal is to turn insights into action. Otherwise, it’s just a pretty PDF collecting dust. (And nobody needs more of those.)
SEO Reporting Tools and Dashboards
A reliable SEO reporting dashboard is essential for simplifying the analysis and presentation of data. These tools automate data collection, visualize complex metrics, and provide actionable insights for businesses and agencies. Selecting the right tools can significantly enhance the efficiency and effectiveness of your reporting process.
Here are some of the best tools for creating comprehensive SEO reports:
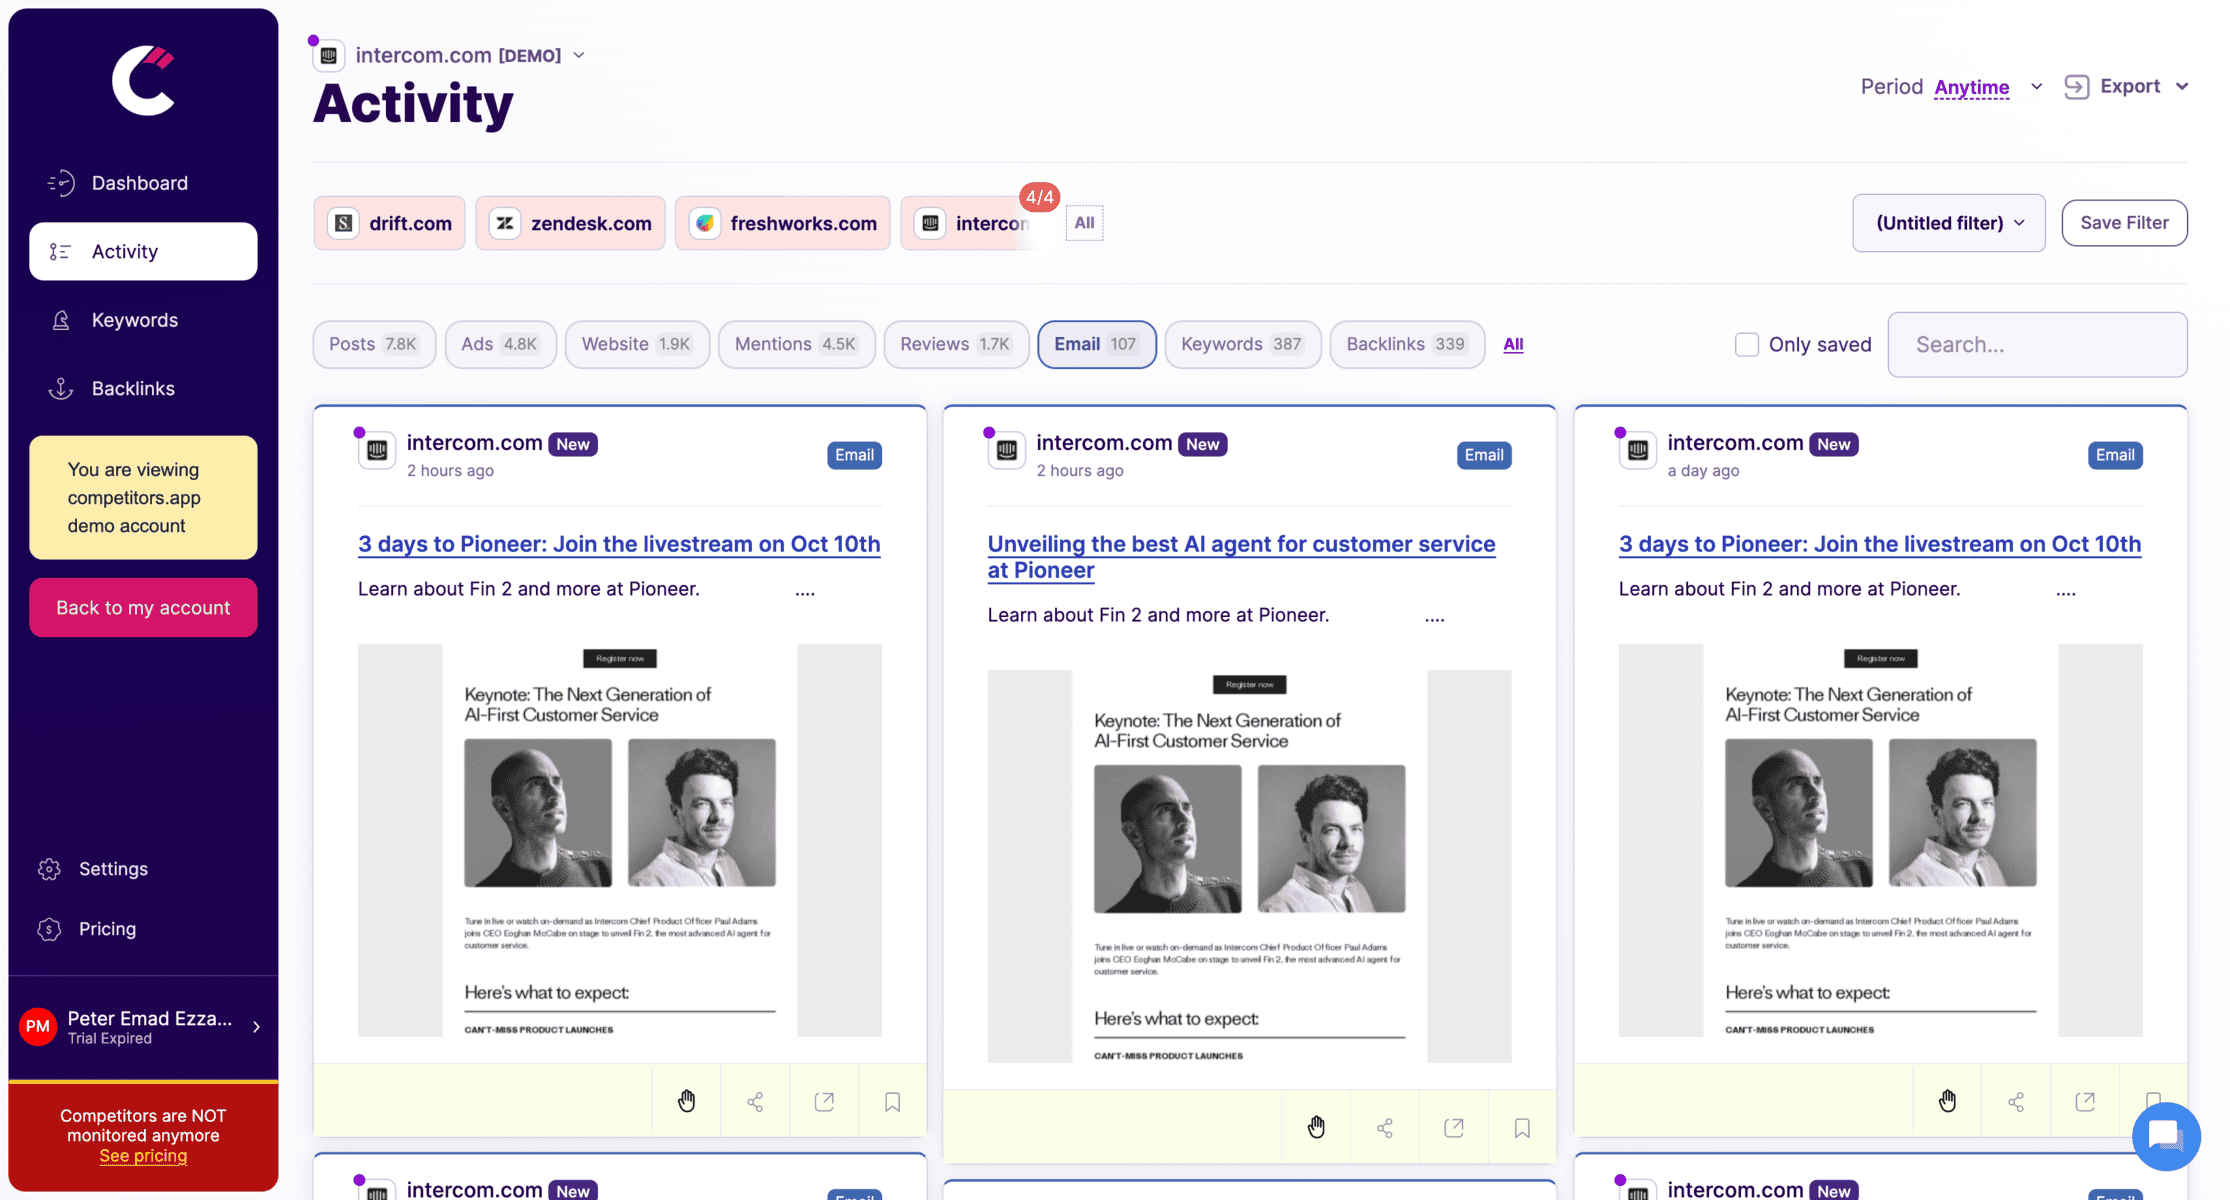
1. Competitors App (Best Value for Money)
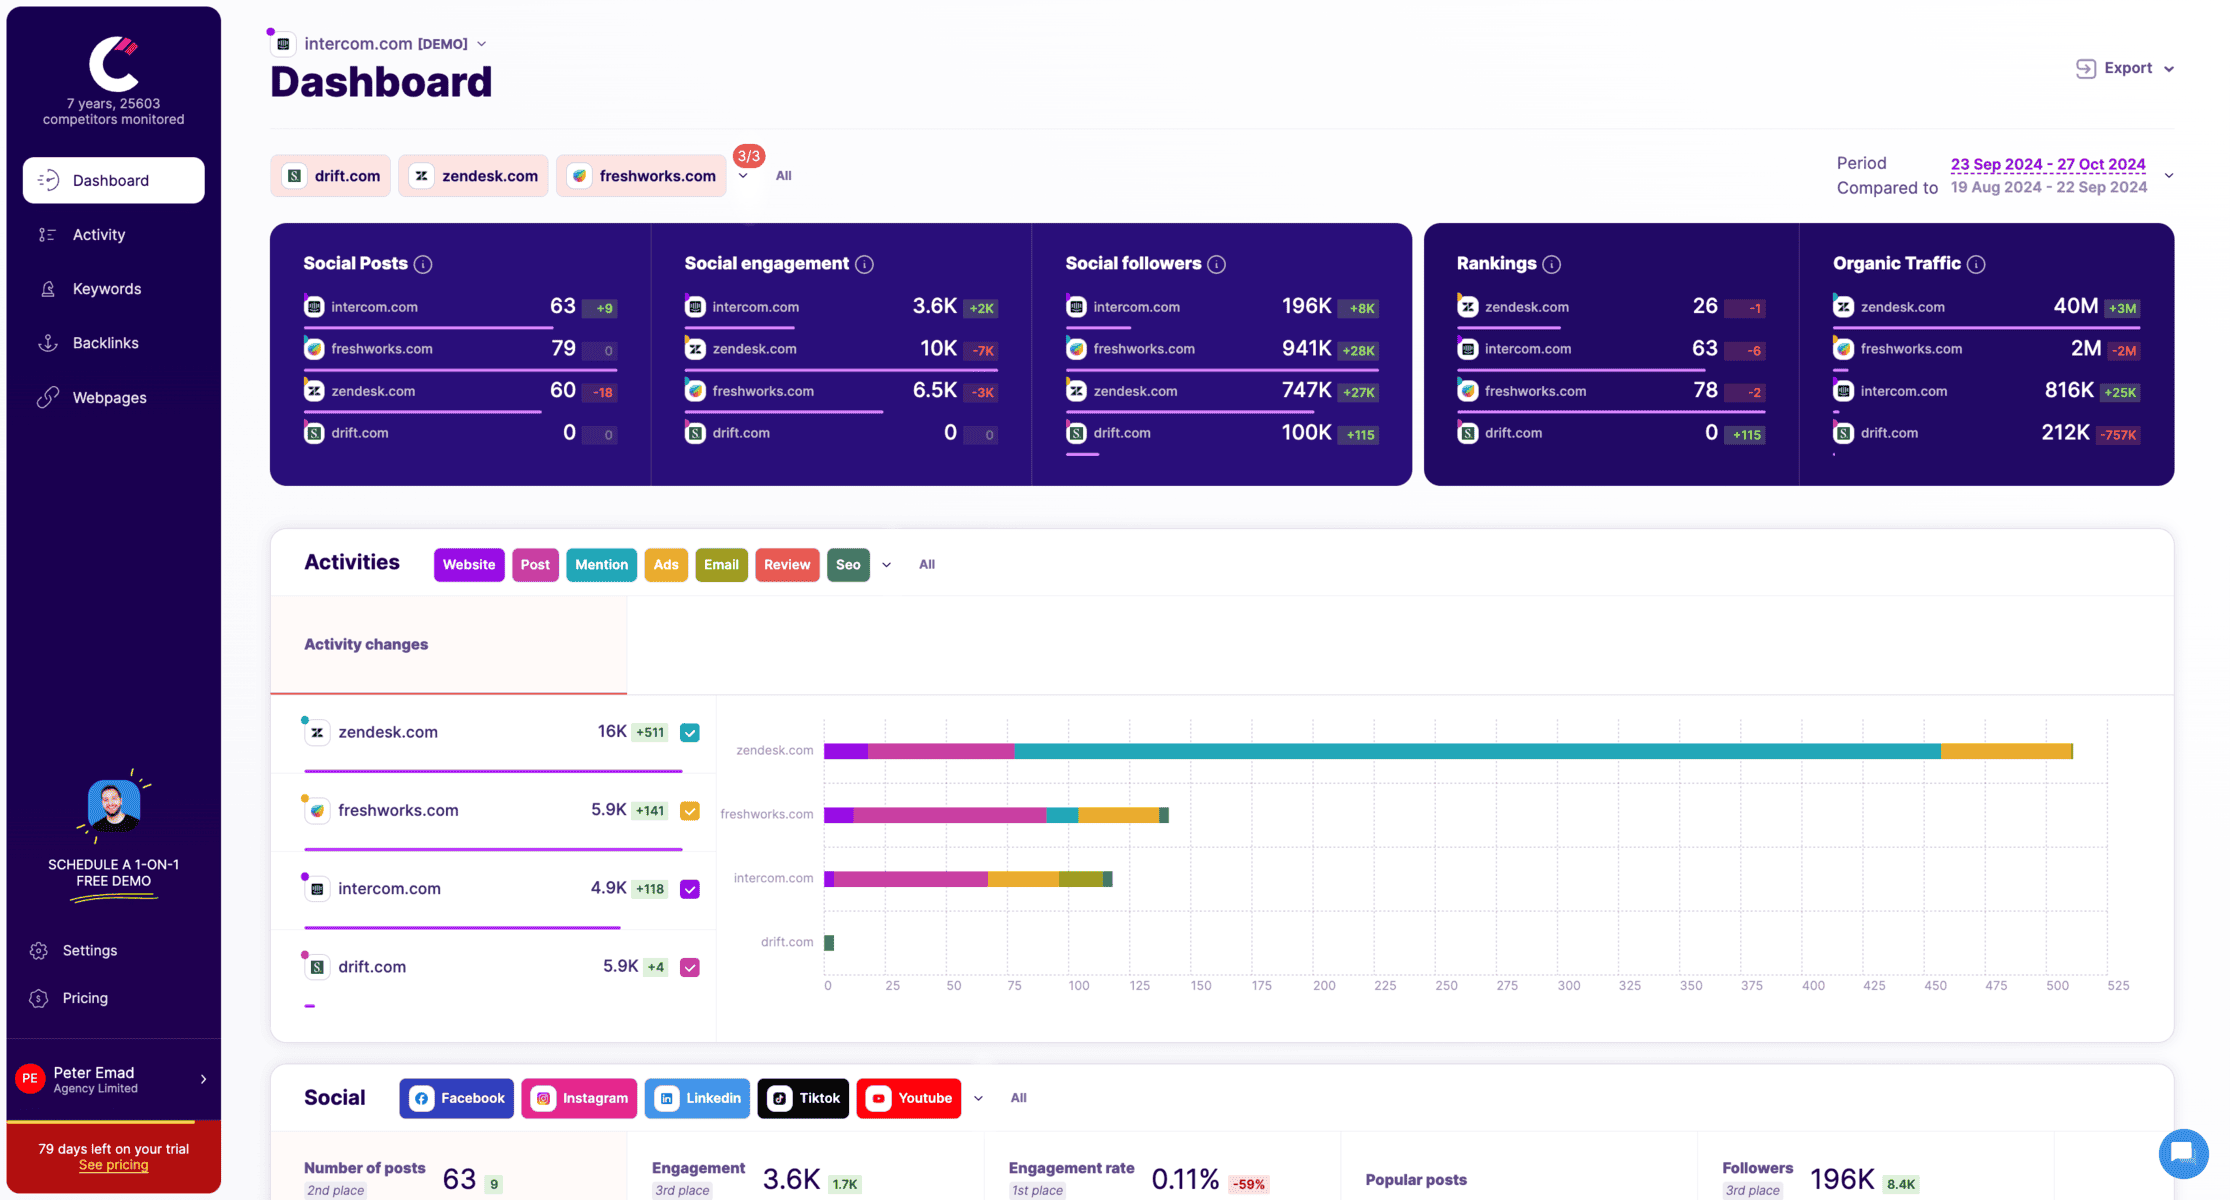
Competitors App is designed to help businesses monitor their competitors and generate actionable SEO insights. It is particularly effective for creating detailed, client-friendly reports that highlight key performance metrics.
Features of Competitors App for SEO Reporting
- Tracks competitor keyword rankings, backlinks, and content updates.
- Provides customizable white label SEO reports for agencies.
- Delivers real-time alerts for changes in competitors’ strategies.
- Integrates seamlessly with other analytics tools for a comprehensive view.
How Competitors App Simplifies SEO Client Reports
Competitors App streamlines the reporting process by automating data collection and formatting.
Its white label SEO reports are fully customizable, allowing agencies to tailor the layout and branding for their clients.
The tool also offers clear visualizations and insights, making complex data easier for clients to understand.
Other Key Features of Competitors App
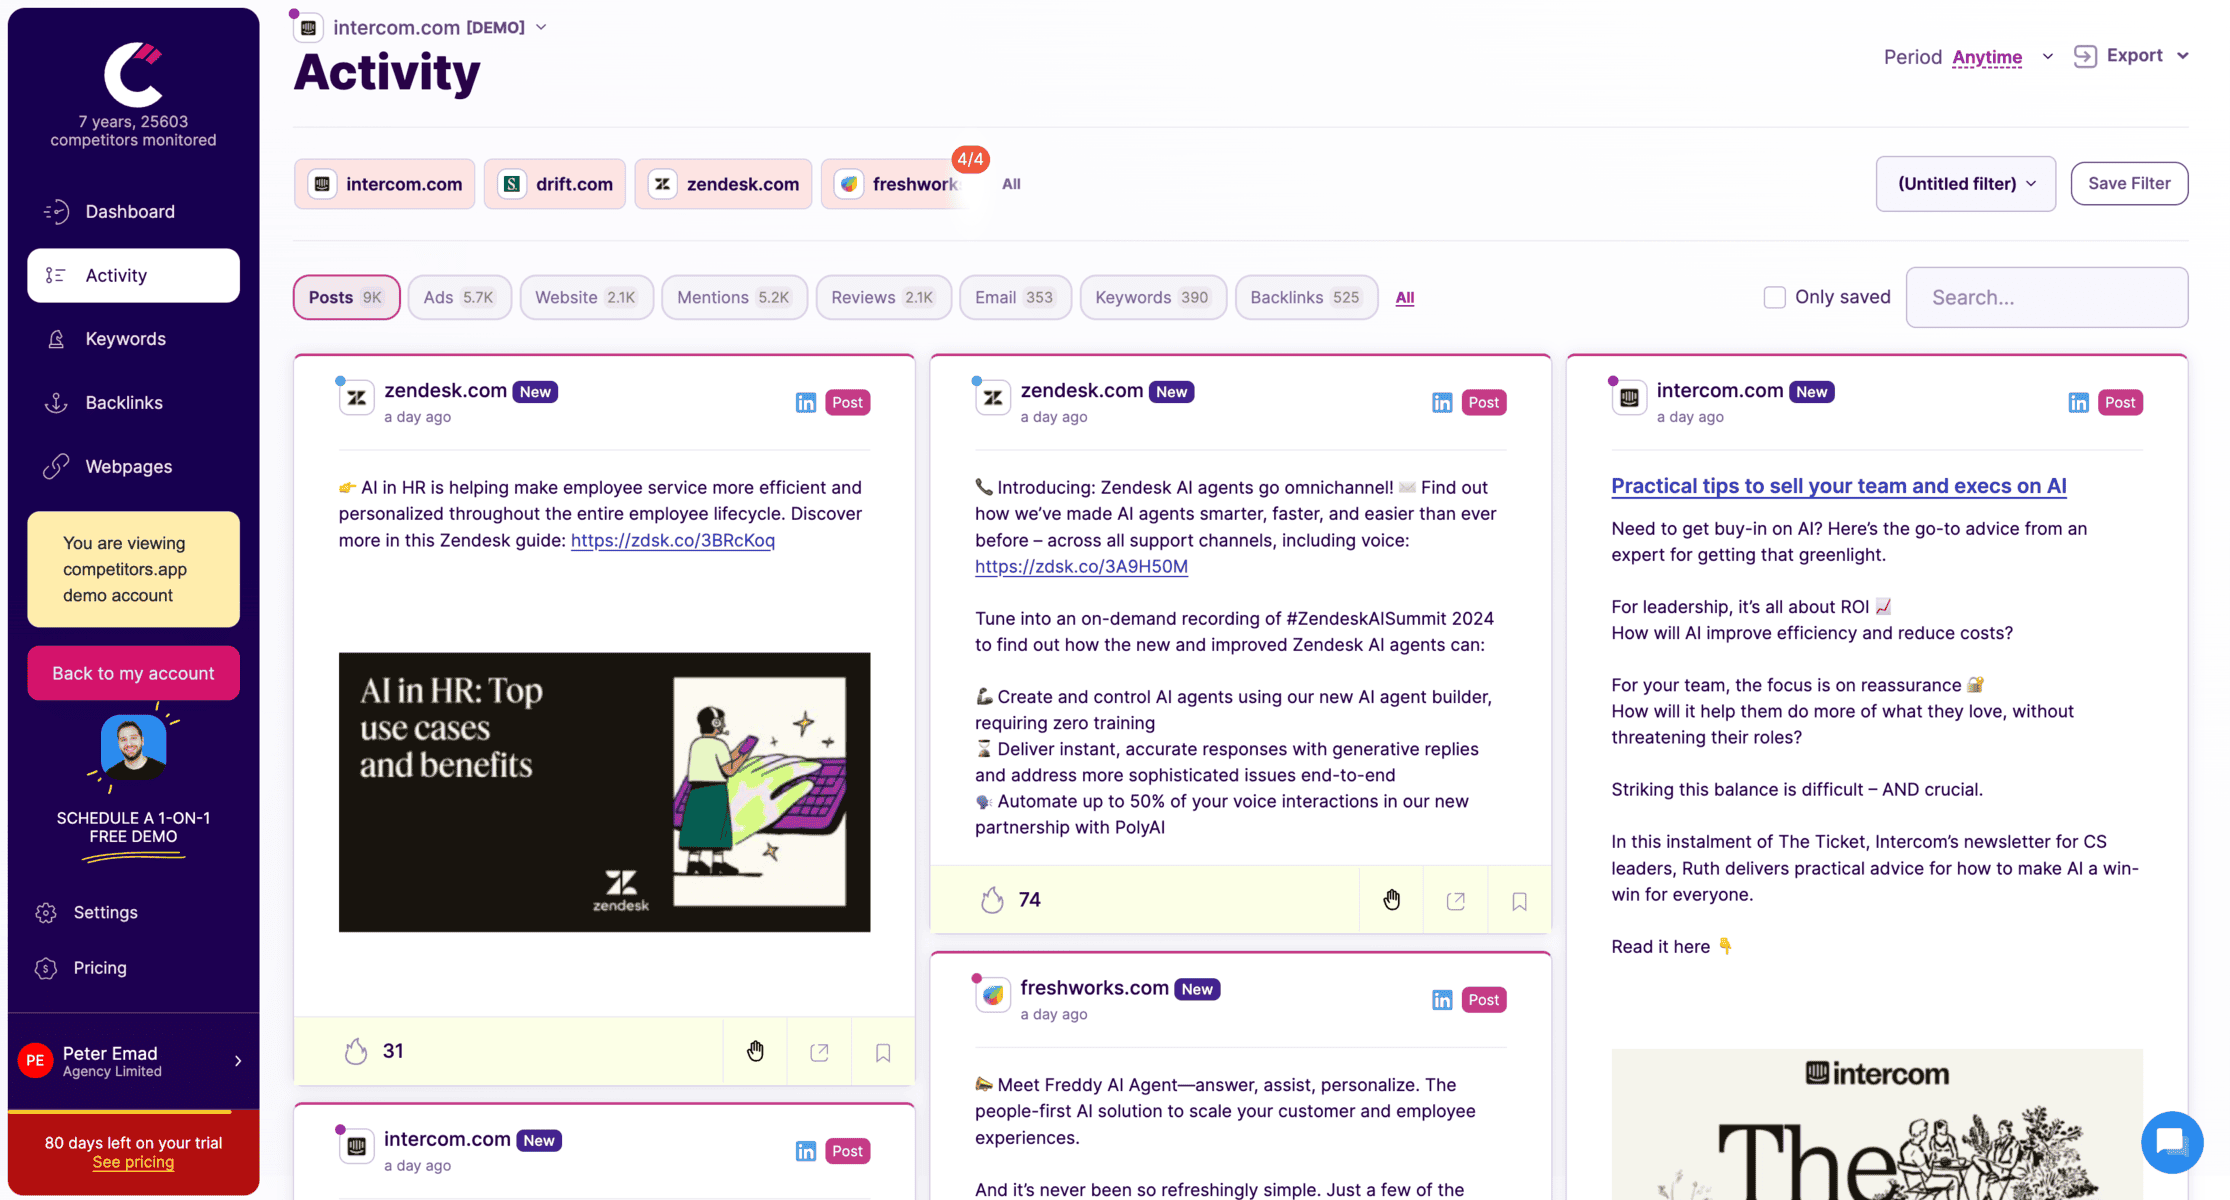
Tracks competitor social media updates across LinkedIn, Facebook, Twitter, and more.
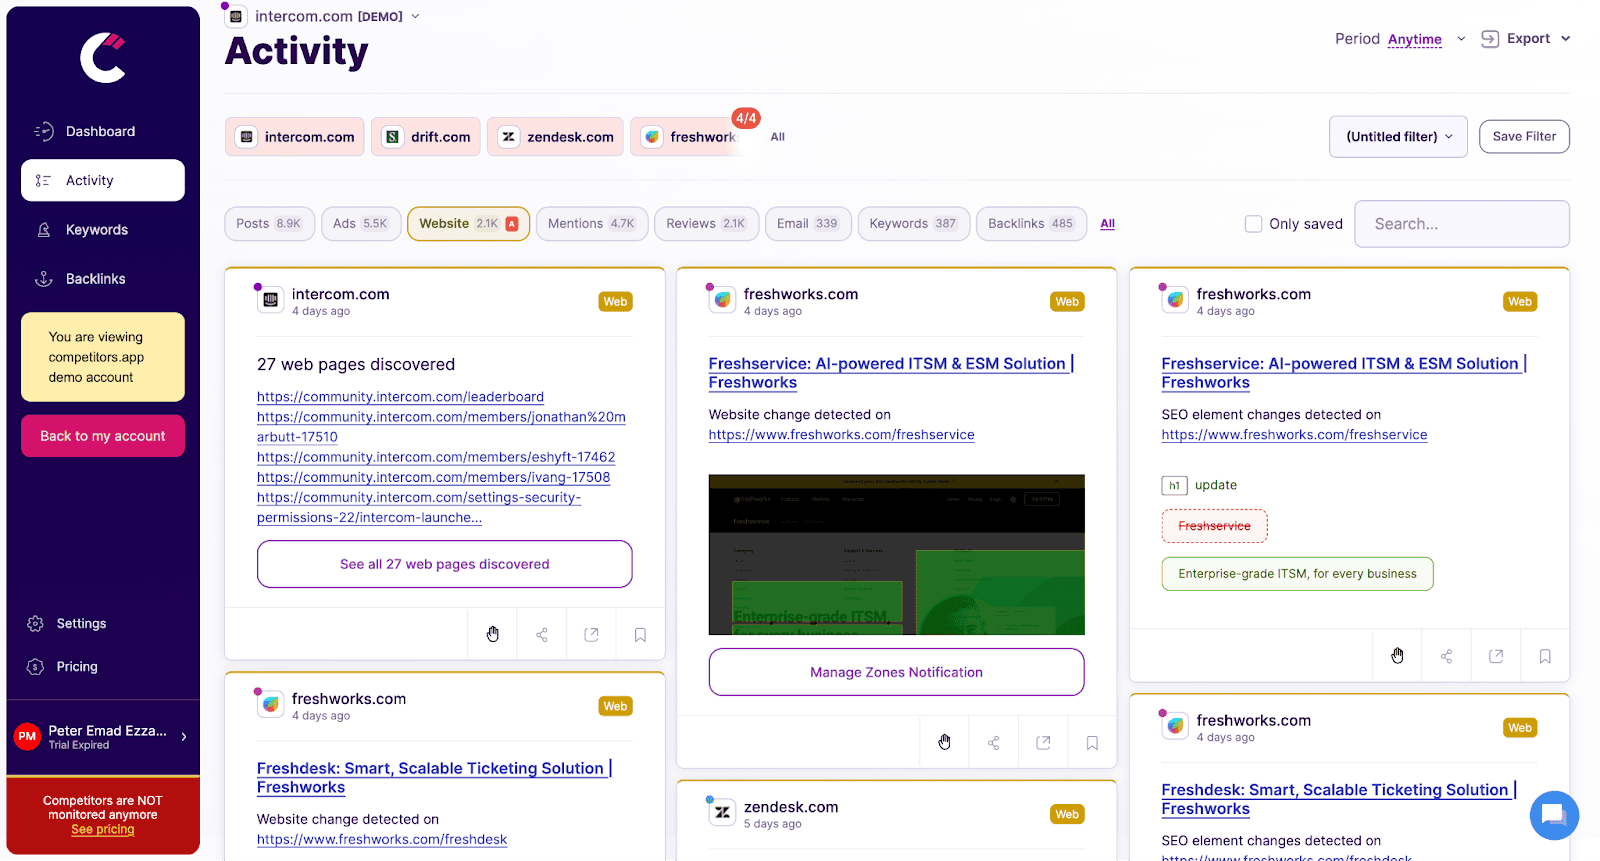
Monitors changes on competitors’ websites, such as product updates, pricing adjustments, and new messaging, providing instant alerts to help sales teams respond promptly.
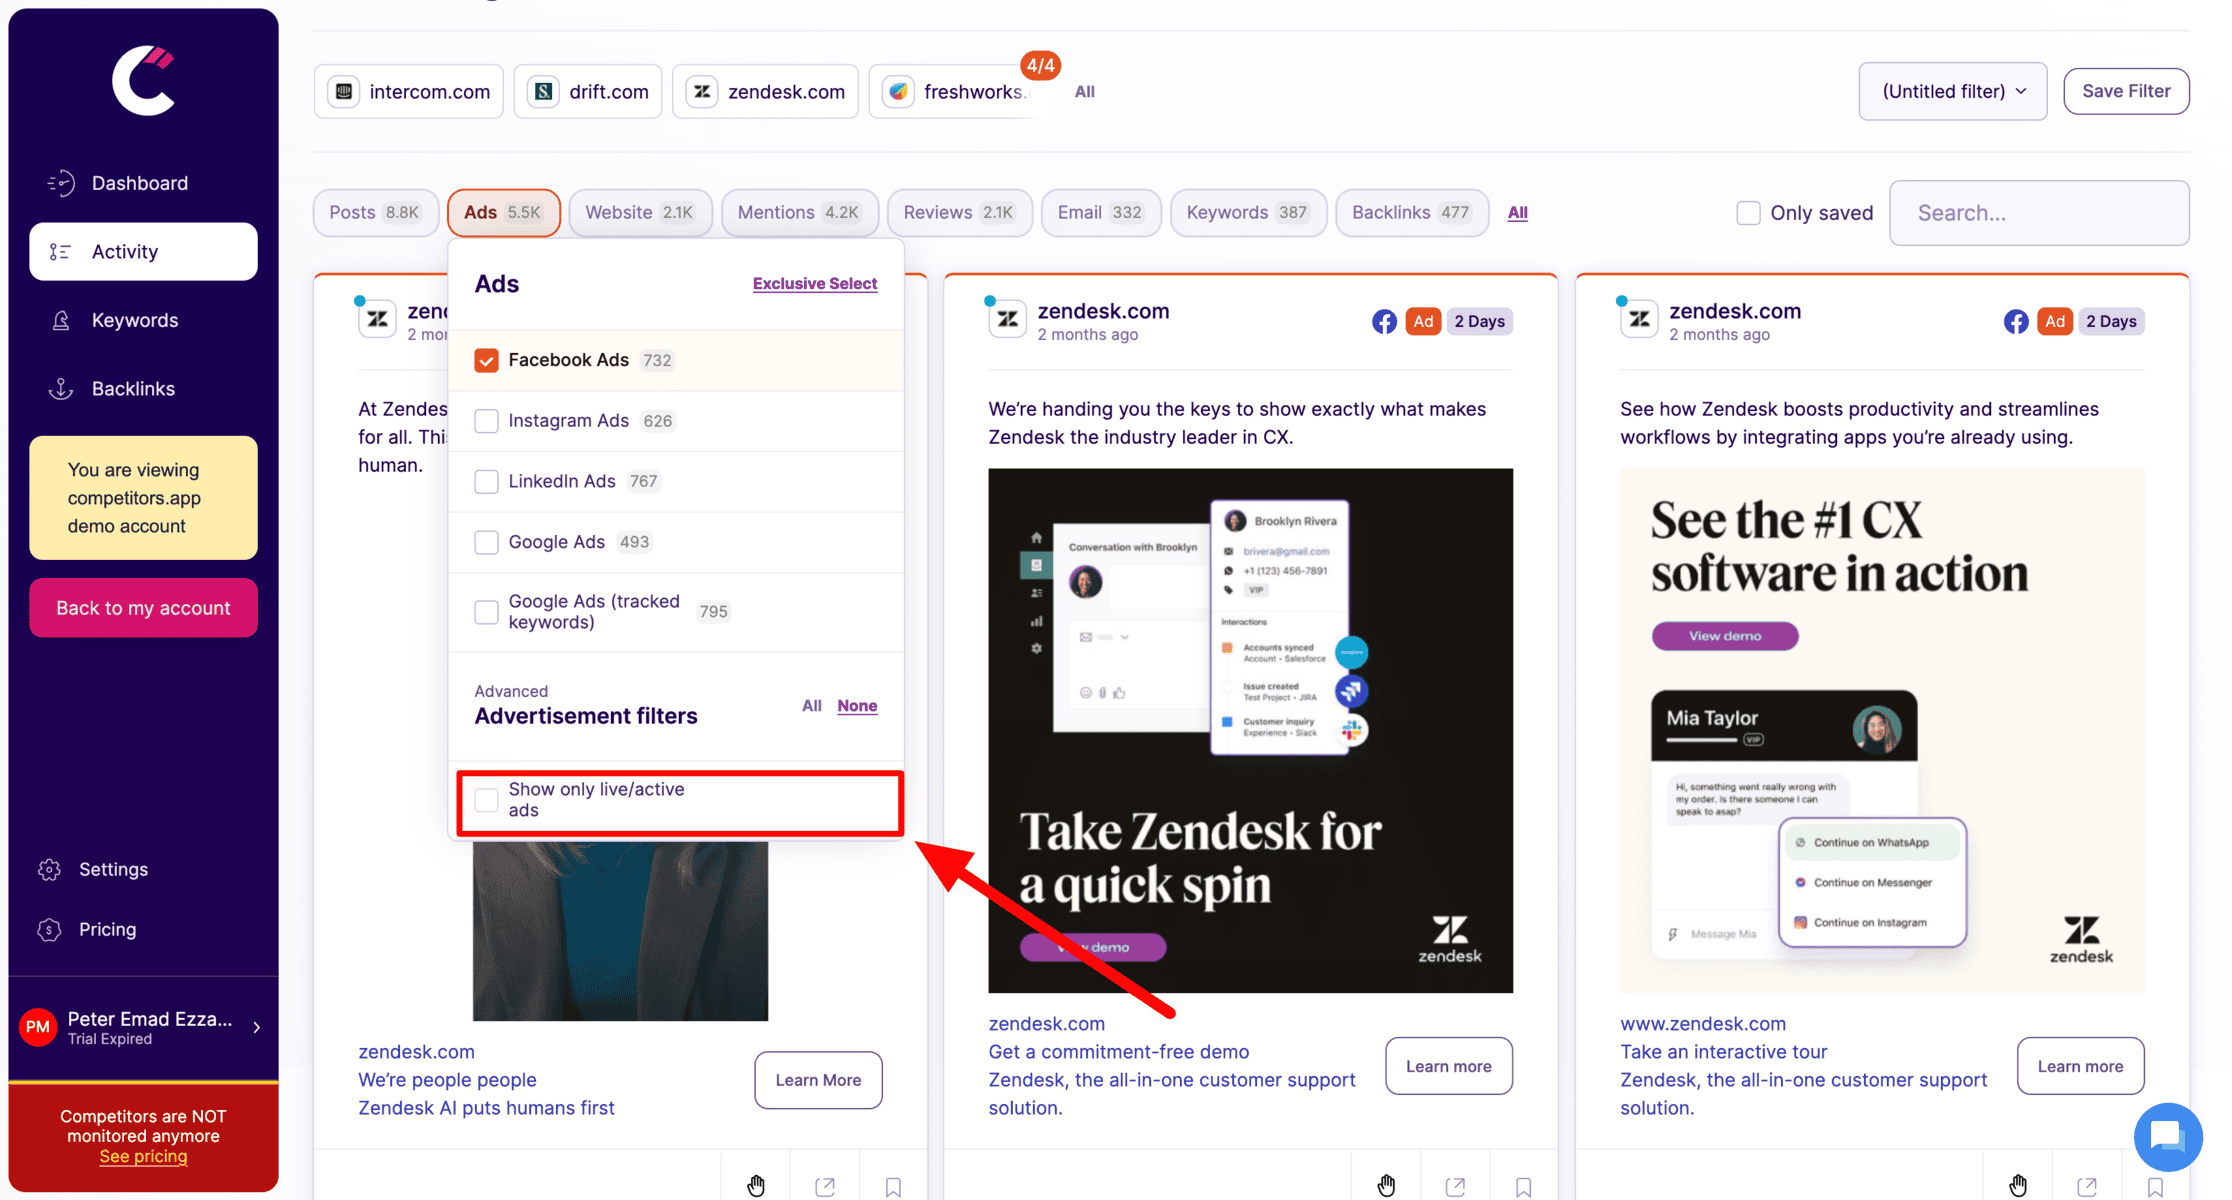
Tracks digital ad campaigns across platforms like Google Ads, Facebook, LinkedIn, and Instagram. It provides details on ad creatives, spending, and performance metrics, helping teams analyze successful ad strategies.
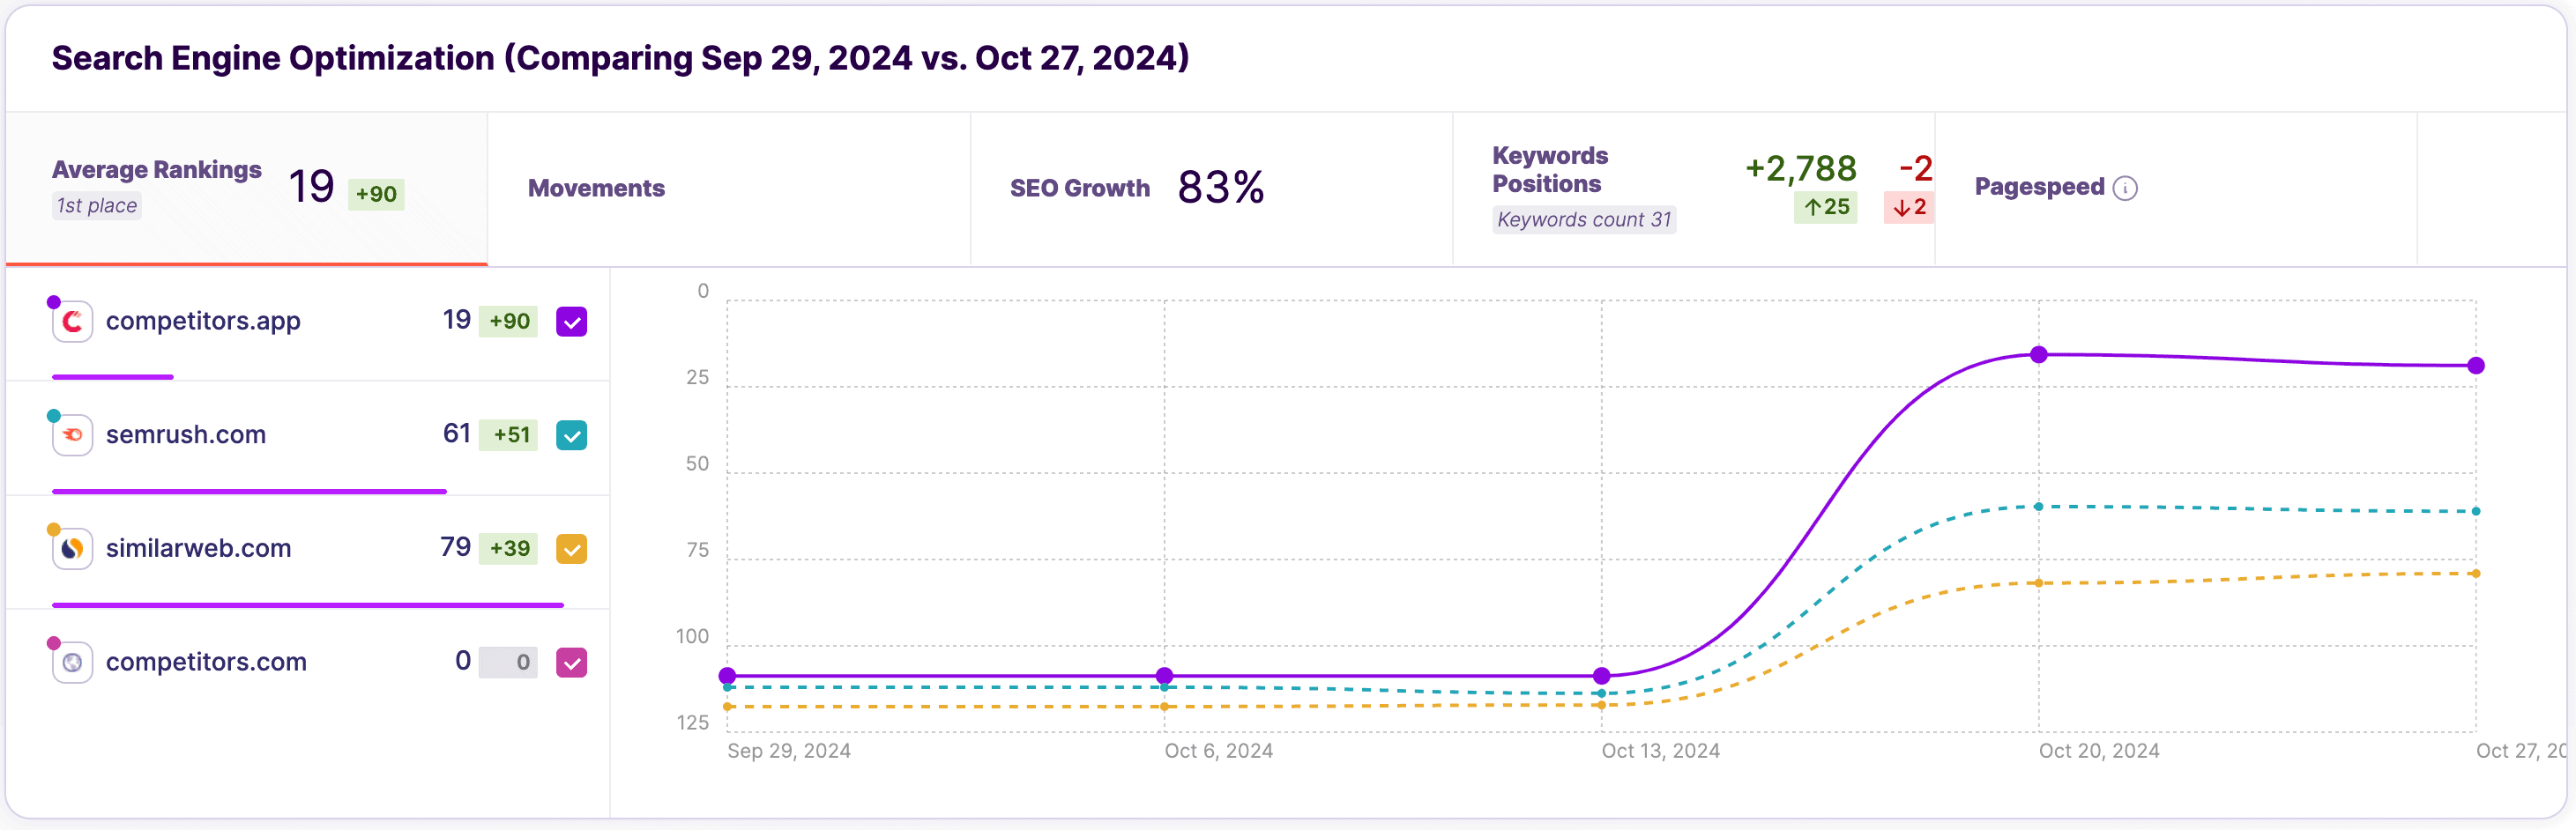
Analyzes competitors’ keyword strategies, organic rankings, and backlinks, allowing teams to refine their own SEO tactics and boost search visibility.
Tracks competitors’ email campaigns, including content, frequency, and engagement metrics, helping sales teams understand email tactics that drive engagement and conversions.
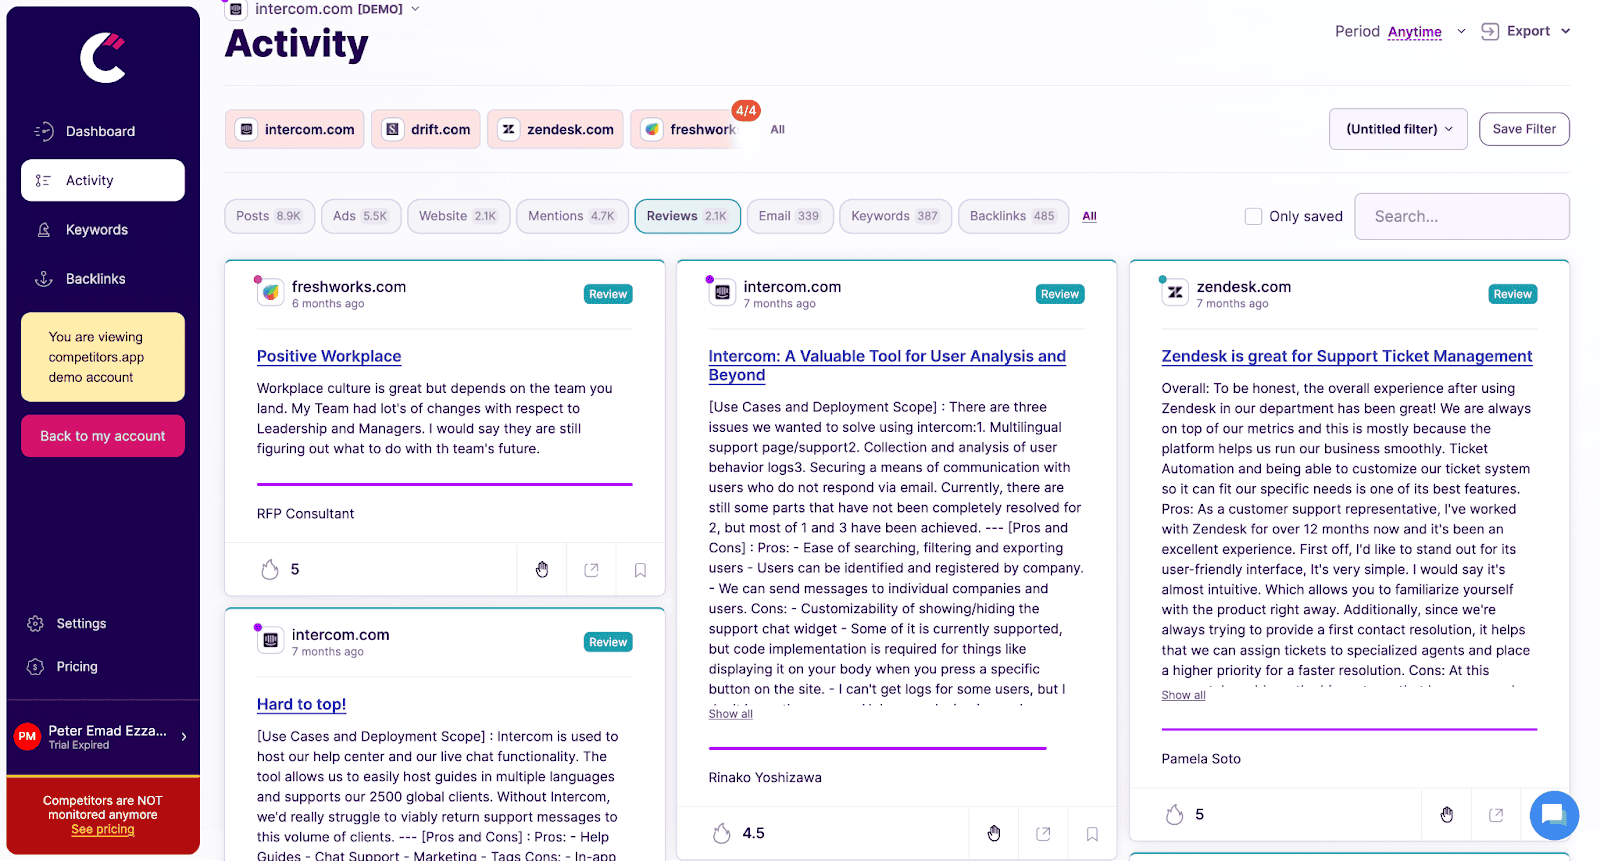
Analyzes customer reviews and ratings for competitors, providing insights into customer feedback, pain points, and product strengths, helping teams craft better sales pitches.
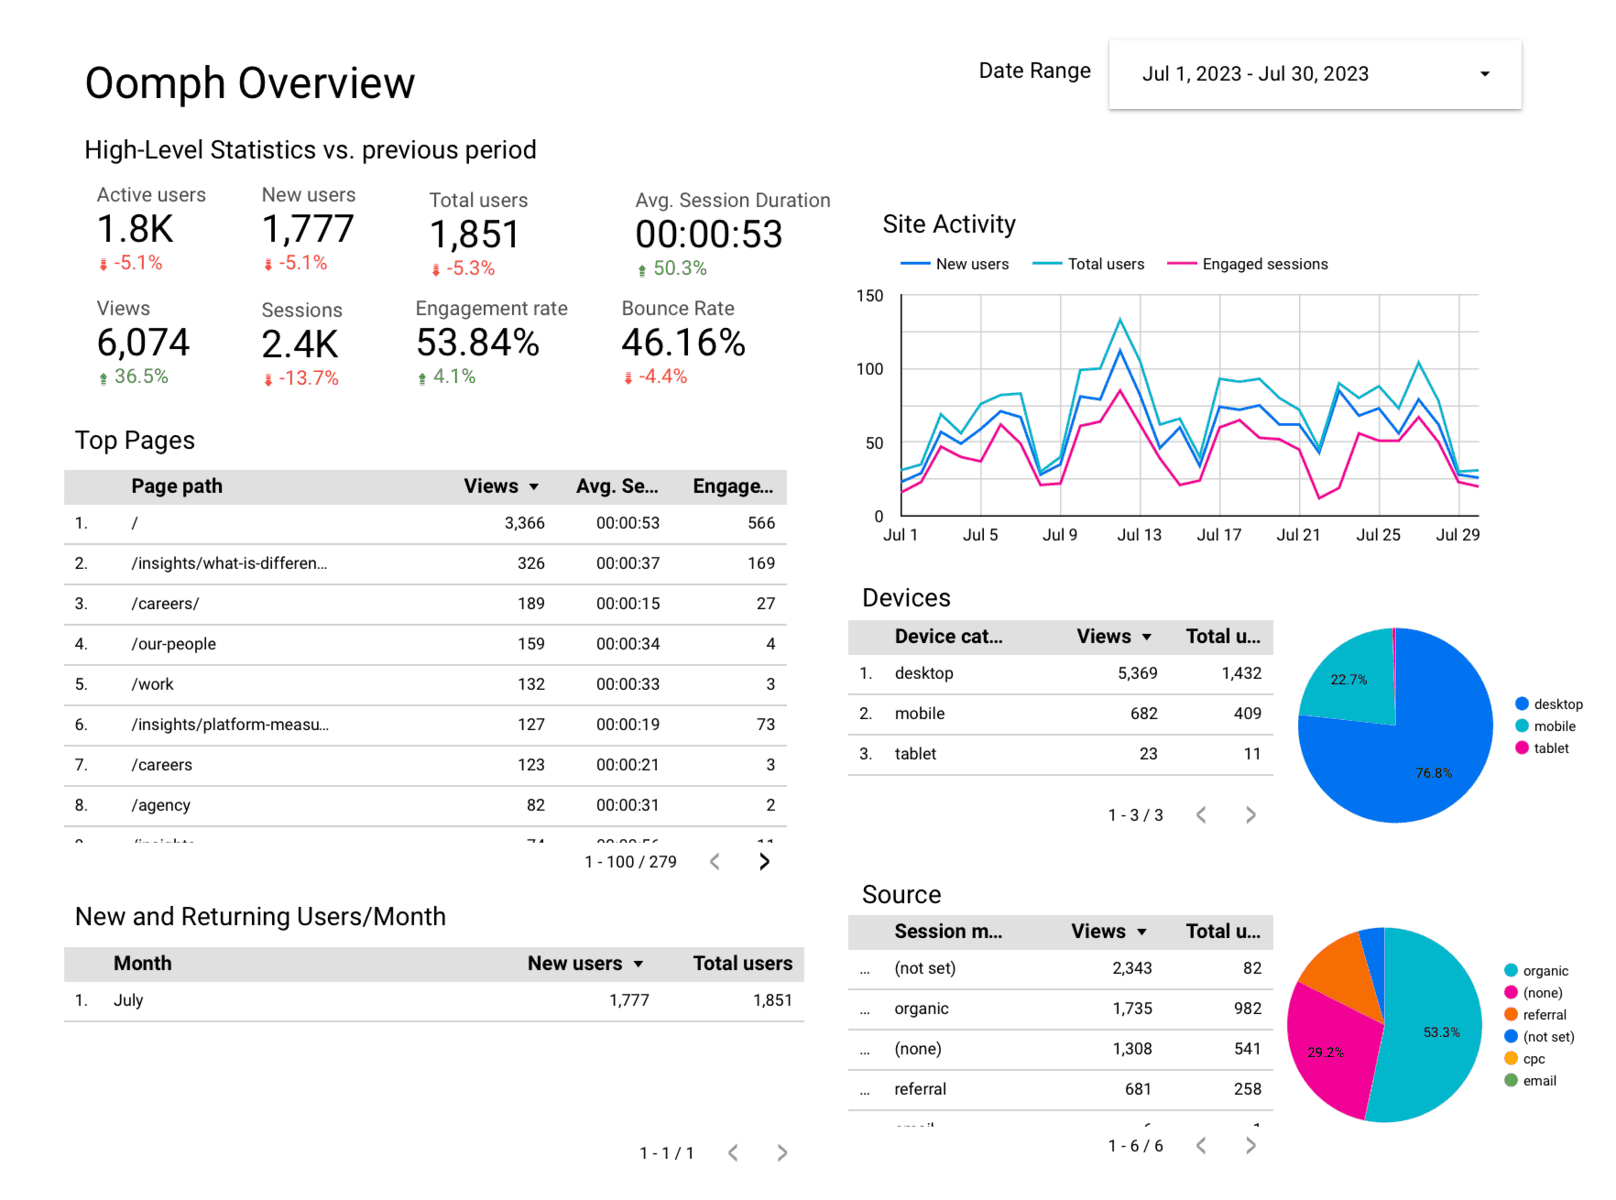
2. Google Analytics
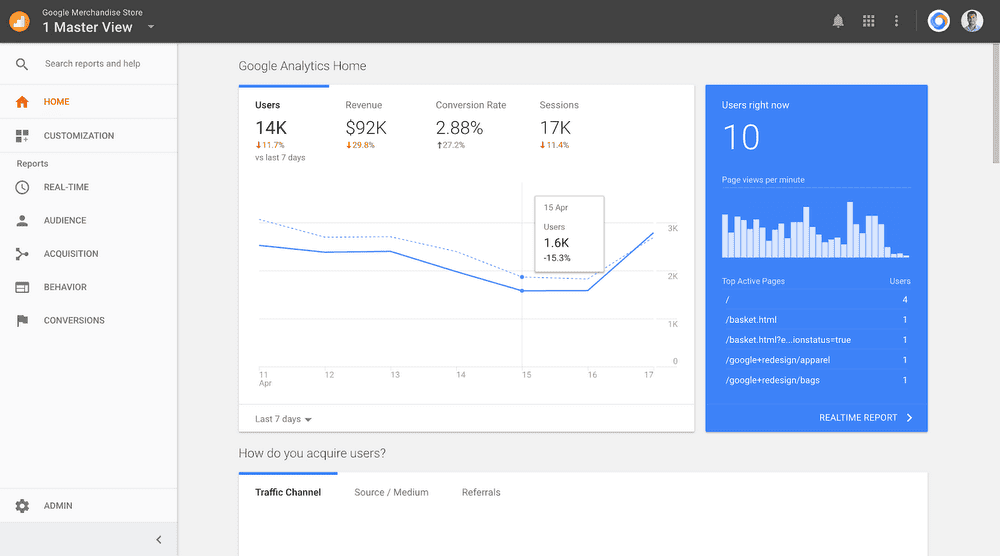
Google Analytics is a cornerstone for SEO reporting, offering robust tracking for website traffic, user behavior, and conversion metrics.
By analyzing organic search traffic in detail, it helps businesses understand how SEO impacts their goals.
3. Google Search Console
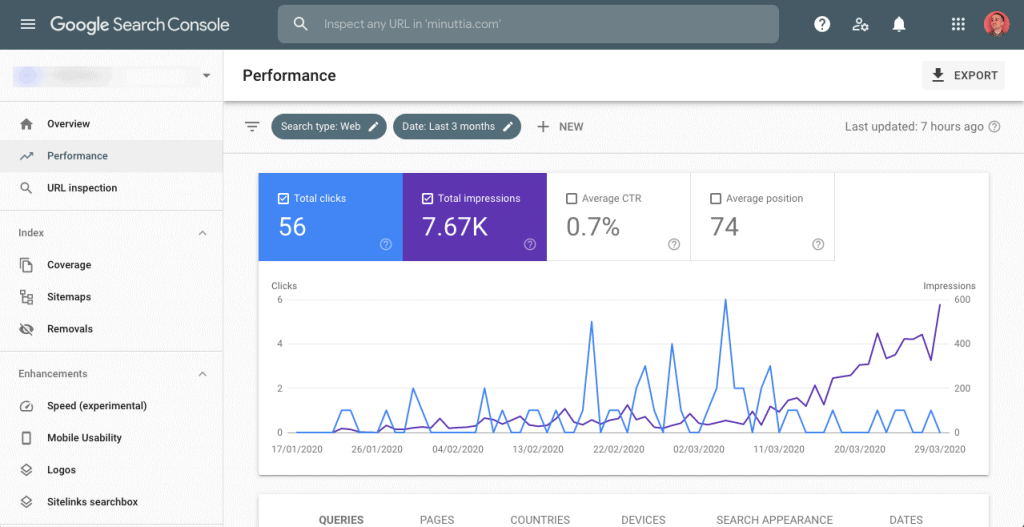
This free tool from Google focuses on website performance in search engines.
It provides insights into click-through rates (CTR), impressions, and indexing issues, making it a vital addition to any SEO report.
4. SEMRush SEO
SEMRush combines competitive analysis, keyword research, and backlink tracking into a single platform.
Its comprehensive suite of tools is ideal for agencies managing multiple clients.
5. Looker Studio
Formerly Google Data Studio, Looker Studio is a highly customizable dashboard for creating visually appealing SEO reports.
It supports data from multiple sources, allowing for deeper analysis and comparisons.
What to Include in an SEO Report? (Without Putting People to Sleep)
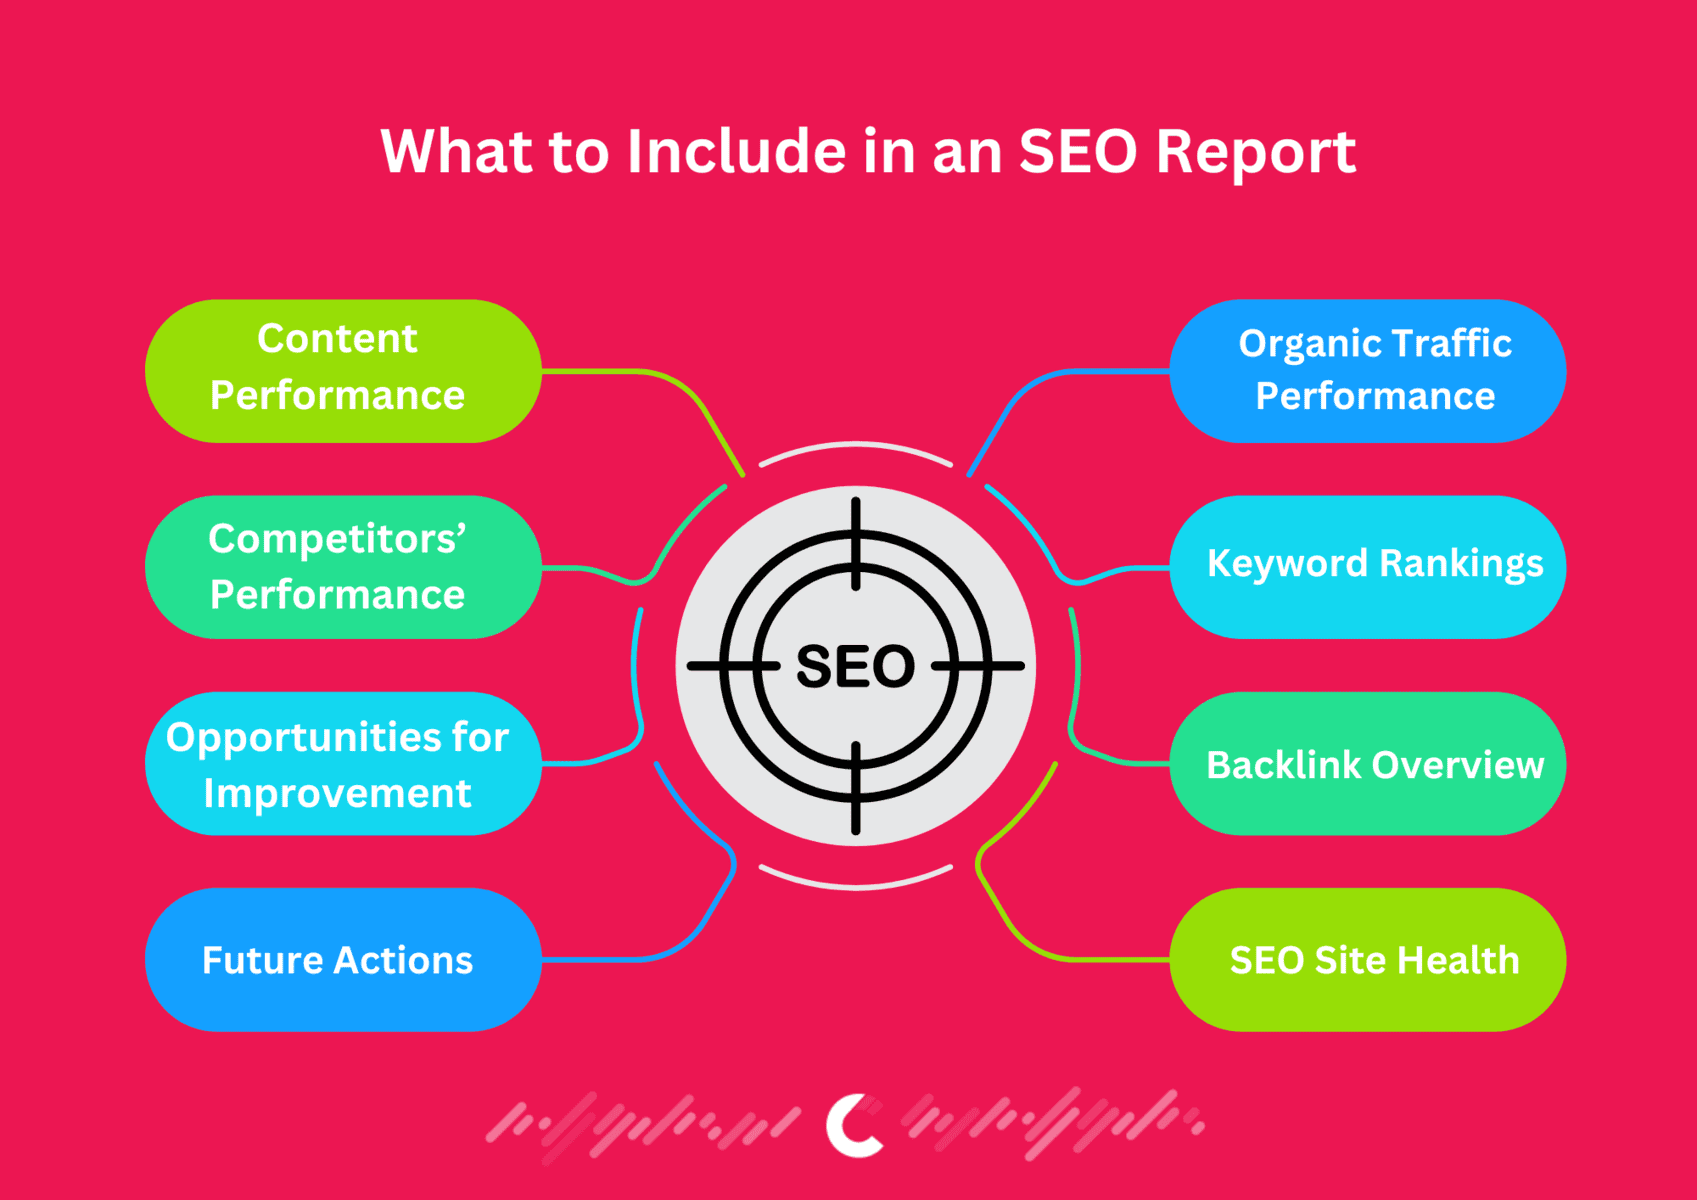
An SEO report shouldn’t feel like reading a tax return. It should be clear, concise, and packed with *“Oh, that’s why we’re not ranking”* moments. Here’s what to include to keep stakeholders awake and excited:
Executive Summary
Start with the TL;DR version. Busy execs don’t have time for fluff. Hit ’em with:
- 🚀 Top Wins: *“Organic traffic up 30% since last quarter.”*
- 📈 Key Metrics: *“Ranked #1 for ‘affordable yoga mats.’”*
- 🎯 Quick Insights: *“Our blog posts about ‘budget travel’ are crushing it.”*
Keep it under 200 words. If they want details, they’ll keep reading.
Organic Traffic Performance
Show how many people are finding you—and whether they’re sticking around. Use Google Analytics to highlight:
- 📊 Traffic Trends: *“Visitors up 25%, but bounce rate’s still high.”*
- 💸 Conversions: *“10% of organic traffic buys something. Not bad!”*
- 🛑 Drop-offs: *“Traffic dipped in March—probably because we ignored Easter keywords.”*
Keyword Rankings
Are you climbing the search ladder or stuck on page 47? Track:
- 🔍 Top Keywords: *“We’re #3 for ‘vegan protein powder.’ Let’s aim for #1.”*
- 📉 Lost Rankings: *“We dropped from #5 to #12 for ‘budget travel tips.’ Time to update that blog.”*
- 🎯 New Opportunities: *“Nobody’s ranking for ‘eco-friendly yoga mats.’ Let’s own it.”*
Backlink Overview
Who’s linking to you—and does it even matter? Use tools like Ahrefs or SEMrush to show:
- 🔗 Quality Links: *“We got 10 new backlinks from .edu sites. Nice!”*
- 🚩 Spammy Links: *“Disavow these 5 sketchy links ASAP.”*
- 🎯 Link-Building Wins: *“Our guest post on TravelBlog.com drove 500 visits.”*
SEO Site Health
Is your site running like a Ferrari… or a rusty bike? Check:
- ⚡ Page Speed: *“Our homepage takes 5 seconds to load. Yikes.”*
- 📱 Mobile-Friendliness: *“Looks great on desktop, but mobile’s a mess.”*
- 🚨 Errors: *“Google found 12 broken links. Let’s fix those.”*
Content Performance
Which blogs are crushing it—and which are flops? Highlight:
- 🔥 Top Performers: *“Our ‘10 Yoga Poses’ post got 10K views. Let’s write more like this.”*
- 💤 Underperformers: *“Our ‘Luxury Skincare’ page has a 90% bounce rate. Maybe ditch the Comic Sans?”*
- 🎯 Content Gaps: *“Nobody’s writing about ‘vegan travel.’ Let’s own that niche.”*
Competitors’ Performance
How do you stack up against the competition? Compare:
- 📊 Traffic: *“We’re getting 50% more visits than Competitor X.”*
- 🔗 Backlinks: *“They have 2x more links, but half are spammy.”*
- 🎯 Opportunities: *“They’re ignoring TikTok. Let’s post dance trends with our product.”*
Opportunities for Improvement
What’s holding you back? Highlight:
- 🔧 Technical Fixes: *“Our site speed’s slower than a sloth. Let’s optimize images.”*
- 🎯 Content Gaps: *“We’re missing keywords like ‘eco-friendly travel.’ Let’s write about that.”*
- 📈 Strategy Tweaks: *“Our email campaigns aren’t converting. Time to A/B test.”*
Roadmap for Future Actions
End with a *“What’s Next?”* plan. Example:
- 📅 Q1: *“Fix site speed errors and launch 5 new blogs.”*
- 📅 Q2: *“Run a backlink campaign targeting eco blogs.”*
- 📅 Q3: *“Double down on TikTok ads.”*
The goal? Turn insights into action—not just another PDF collecting dust.
Best Practices for Creating an SEO Report
Let’s cut the corporate nonsense. SEO reports shouldn’t be napkin-worthy. If your client’s eyes glaze over, you’ve failed. Here’s how to make it *actually* useful:
Be Data-Led and Actionable
Ditch the vanity metrics. Focus on what *moves money*. Example:
- 📊 KPIs That Matter: *“Organic traffic’s up 25%, but conversions are flat. WTF? Let’s fix the checkout page.”*
- 🔧 Actionable Tips: *“This keyword’s stuck on page 2. Add 3 internal links and rewrite the meta—no more ‘Welcome to our site’ crap.”*
If a metric doesn’t answer *“So what?”* delete it. Your client doesn’t care how many backlinks you found.
Provide Context and Insights
Numbers are useless without drama. Example:
- 📉 Traffic Drop: *“Traffic tanked 15% in March. Why? Google’s update nuked our AI-generated fluff. Lesson: Write for humans, not bots.”*
- 📈 Traffic Spike: *“Visitors doubled in December because Karen in marketing finally posted that holiday gift guide. More of that, please.”*
Pro tip: Use **analogy** over jargon. *“Our site speed’s slower than DMV Wi-Fi”* > *“Core Web Vitals need improvement.”*
Use Visuals to Enhance Understanding
Nobody reads paragraphs. Fight me. Use:
- 📊 Line Graphs: *“Here’s our traffic looking like a rollercoaster. Hold on!”*
- 📉 Comparison Tables: *“We’re crushing Competitor X on blogs but losing on product pages. Oops.”*
- 🎯 Meme Charts: Yes, really. *“Our backlink profile: 80% quality vs. Competitor’s 50% spam.”*
Tools? Canva for quick edits. Excel for masochists.
Segment Data for Clarity
Break it down like a TikTok dance tutorial:
- 📱 By Device: *“70% of traffic’s mobile, but desktop converts 2x better. Fix mobile UX or miss $$$.”*
- 🌍 By Location: *“Texas loves our boots content. Nebraska? Crickets. Let’s pivot.”*
- 🔗 By Source: *“Organic’s carrying us. Social’s dead—time to hire that Gen Z intern.”*
Include Recommendations and Next Steps
End with a *“Here’s Exactly What We’ll Do”* plan. Example:
- 🔧 Technical Fixes: *“Fix broken links by Friday. Yes, Brad, that includes your blog from 2018.”*
- 🎯 Content Ideas: *“Write 5 posts about ‘sustainable cowboy boots.’ Yes, that’s a thing.”*
- 📈 Strategy Tweaks: *“A/B test pricing pages. If it flops, blame the copywriter.”*
No vague BS. Clients crave deadlines and drama.
Common Challenges in SEO Reporting
Handling Data Overload
SEO reporting tools are like a firehose of data—too much and you’ll drown. Google Analytics, Search Console, Ahrefs… it’s easy to get lost in 50 charts that answer *nobody’s* actual questions. Here’s how to survive:
- 🎯 Focus on KPIs that matter: If the client cares about sales, show *“organic traffic → checkout page conversions”*—not “total sessions.”
- 📊 Visuals over spreadsheets: Turn a 20-column table into a simple line graph titled *“How our blog traffic doubled (while Competitor X flatlined).”*
Pro tip: If your report looks like a NASA control panel, you’ve failed. Simplify or die.
Communicating Technical Insights to Non-Technical Audiences
Explaining “crawl errors” to a CEO is like teaching your grandma TikTok. Here’s the cheat code:
- 🔧 Use analogies: *“Fixing site speed is like upgrading from a bicycle to a Tesla—your customers get there faster and spend more.”*
- 💸 Focus on money: *“Fixing these 10 broken links could recover $5K/month in lost sales.”*
- 🚫 Avoid robot mode: Never say *“Your hreflang tags are misconfigured.”* Say: *“Google’s confused about your language settings. Let’s fix it so French customers find you.”*
Addressing Traffic Declines and Negative Trends
When traffic tanks, clients panic. Your job? Be the therapist.
- 📉 Blame Google (tactfully): *“Traffic dropped 20% last month. Why? Google’s update penalized thin content—but we’re already rewriting 10 pages.”*
- 🎯 Offer a comeback plan: *“Let’s target ‘sustainable yoga mats’—Competitor X ranks #1, but their content sucks.”*
- 🌦️ Seasonal context: *“Traffic always dips in August. Let’s prep a holiday guide now to dominate Q4.”*
Remember: SEO isn’t a magic wand. Bad months happen. Be honest, but give them hope (and a plan).
How to Present an SEO Report
Let’s be real: An SEO report is useless if your client’s eyes glaze over. It’s not about data—it’s about making them care. Here’s how to present like a pro (without sounding like a robot):
Simplifying Complex Data
Ditch the spreadsheets. Your client doesn’t care about rows 1-500. Instead:
- Turn keyword rankings into a meme-worthy line graph: “Look how we crushed Competitor X!”
- Explain bounce rate like this: “People click, go ‘meh,’ and leave. Let’s fix that.”
- Never say “Your crawl budget is insufficient.” Say: “Google’s ignoring 20% of your site. Let’s fix it.”
Pro tip: If your report feels like a textbook, you’ve failed. Aim for “Netflix documentary.”
Aligning the Report with Client Goals
Start every report by yelling (politely): “Here’s how we’re hitting YOUR goals!” Example:
Client Goal: “Get more local customers.” Your Slide: “We ranked #1 for ‘best coffee in Austin.’ Map pack traffic up 200%. Cha-ching!”
If the data doesn’t tie to their goal, delete it. No one cares about your 50-column vanity metrics.
Creating a Narrative Around the Data
Turn numbers into a story. Example:
- Act 1 (Conflict): “Traffic tanked after Google’s December update.”
- Act 2 (Action): “We rewrote 10 blog posts and fixed site speed.”
- Act 3 (Victory): “Traffic bounced back +15%. Competitors are crying.”
Clients love drama. Give them a hero’s journey—with their brand as the star.
Tips for Sharing Reports Effectively
- Murder the fluff: If a slide doesn’t spark a “Huh!” or “Oh shit!” reaction, delete it.
- Visuals are king: Use Canva templates, not Excel hellscapes. Example: “Our traffic vs. competitors” as a wrestling match meme.
- Next steps or GTFO: End with “Here’s exactly what we’ll do next quarter (and why it’ll work).”
- Follow-up = $$$: Schedule a 15-min call to answer questions. Bonus: Send a Loom video walking through the report.
Pro Tip: If your client says “This looks great!”, you’ve failed. Aim for “Wait, explain this part again—it’s fascinating!”
Frequently Asked Questions
What Is an SEO Report?
An SEO report is a document or dashboard that presents data on a website’s SEO performance. It includes metrics like organic traffic, keyword rankings, and backlinks to help evaluate the success of SEO strategies and identify areas for improvement.
How Often Should You Create an SEO Report?
The frequency depends on the goals and audience. Monthly reports are common for tracking progress and keeping clients informed, while weekly or real-time dashboards may be necessary for ongoing campaigns or time-sensitive projects.
What Metrics Should Be Included in an SEO Report?
The key metrics to include depend on your objectives but typically include:
- Organic traffic
- Keyword rankings
- Backlink performance
- Conversion rates
- SEO site health (e.g., technical errors, page speed)
Can SEO Reports Be Automated?
Yes, automation tools like Competitors App, Looker Studio, and SEMRush can streamline the process. These tools integrate data from various sources, create visualizations, and allow for scheduled, recurring reports, saving time and reducing manual effort.
What Are White Label SEO Reports?
White label SEO reports are customizable reports that agencies can brand as their own. These reports maintain a professional appearance while allowing the flexibility to include the metrics and branding specific to the agency or client.
How Do You Handle Negative Trends in an SEO Report?
Negative trends, such as traffic declines, should be addressed with context. Identify potential causes (e.g., algorithm changes, seasonal drops), provide insights, and recommend actionable steps to reverse the trend. Transparency is key to maintaining trust.
Why Is SEO Reporting Important?
SEO reporting connects performance data to business goals, builds trust with stakeholders, and provides actionable insights for continuous improvement. It ensures all efforts are data-driven and focused on achieving measurable results.