Understanding how your competitors operate is crucial for staying ahead in today’s fast-paced business environment. One of the most effective ways to do this is by using a competitor analysis dashboard, which consolidates all the critical data about your competitors into one easy-to-read platform.
Whether you’re monitoring product launches, pricing changes, or marketing campaigns, a dashboard offers real-time insights that help shape your strategy. This guide will walk you through the steps of building a powerful competitor analysis dashboard that can keep you informed and agile in an ever-evolving market.
What is a Competitor Analysis Dashboard?
A competitor analysis dashboard is a tool that helps businesses track, organize, and analyze real-time data about their competitors. It offers a clear view of key metrics, such as product developments, marketing strategies, and pricing changes, all in one place.
Instead of manually searching for information, a dashboard compiles data from various sources, making competitor research and analysis much more efficient. With this streamlined approach, companies can easily spot trends, respond faster to market changes, and make data-driven decisions that help them stay ahead of the competition.
Why a Competitor Analysis Dashboard is Essential for Your Business
A competitor analysis dashboard is vital for any business that wants to make informed decisions based on up-to-date competitor data. By providing real-time insights, it helps businesses identify gaps in their own strategies and spot opportunities in the marketplace. Whether you’re in marketing, sales, or product development, having a dashboard that tracks competitor activity ensures you stay agile and responsive. Here are a few key benefits:
- Real-time competitor insights allow for faster decision-making.
- Improved benchmarking helps you compare your performance with competitors.
- Informed marketing and sales strategies based on competitor movements.
- Identification of market opportunities to outmaneuver the competition.
This makes the dashboard an essential tool for staying competitive in a fast-moving business environment.
Key Metrics to Track in a Competitor Analysis Dashboard
To get the most value from your competitor analysis dashboard, tracking the right metrics is essential. These metrics will vary based on your business goals, but they typically focus on areas where competitors can directly impact your market share. Monitoring key performance indicators helps you stay informed and respond quickly to changes. Below are the core metrics every business should consider:
1. Product and Service Developments
Tracking product and service developments is crucial in understanding how your competitors are evolving. Monitoring new product launches, feature updates, and service improvements gives you a clear picture of their growth and innovation. This information can be used to anticipate market trends and adapt your offerings accordingly.
2. Marketing Strategies and Promotions
Another critical metric to track in your competitor analysis dashboard is their marketing strategies and promotions. By monitoring advertising campaigns, social media activities, and promotional offers, you can gain insights into how your competitors are engaging with their audience. This allows you to identify which tactics are working for them and adjust your marketing efforts to stay competitive. Understanding their promotional timing and messaging can also help you plan more effective campaigns that capture customer attention at the right moments.
3. Competitor Pricing Strategies
Monitoring competitor pricing strategies is essential for understanding how they position their products or services in the market. A competitor analysis dashboard helps you track pricing trends, discounts, and promotions over time, allowing you to identify fluctuations or patterns. This insight can inform your own pricing decisions, ensuring you remain competitive without undercutting your profitability. By closely watching how competitors adjust their prices in response to market changes or product launches, you can stay proactive and adjust your strategy as needed.
4. Market Share and Trend Analysis
Market share and trend analysis are key components of a robust competitor analysis dashboard. Tracking how competitors are gaining or losing market share helps you understand their position in the industry and identify shifts in customer behavior. By analyzing trends, such as new entrants into the market or changes in consumer preferences, you can adjust your strategies to capitalize on emerging opportunities. This data not only shows how competitors are performing but also highlights broader market dynamics that could impact your business.
5. Win/Loss Analysis
Win/loss analysis is a valuable metric in any competitor analysis dashboard, offering insights into how often you win or lose deals against specific competitors. By tracking sales outcomes, you can identify patterns that reveal why customers choose your products or services over others—or why they don’t. This data allows your sales and marketing teams to refine their approach, improving conversion rates and addressing weaknesses in your pitch. Understanding what drives wins and losses helps you refine your strategy to outperform competitors in future opportunities.
Steps to Building a Competitor Analysis Dashboard Using Competitors App
Step 1: Define Your Goals and KPIs
Before building your competitor analysis dashboard, the first step is to define your business goals and identify the key performance indicators (KPIs) that align with them. Whether you’re focusing on pricing strategies, product development, or marketing campaigns, having clear KPIs will guide the entire process. These metrics will help you stay focused on the most critical insights that matter to your business, ensuring your dashboard reflects actionable data that supports your overall objectives.
Step 2: Choose the Right Competitor Monitoring Tool
Selecting the right tool is essential for efficiently gathering and tracking competitor data. Competitors App is an ideal choice as it automates much of the competitor research and analysis process. The tool pulls data from multiple sources, including websites, social media, and online ads, providing a steady stream of insights without manual effort. By integrating a tool like Competitors App into your workflow, you can streamline the data collection process and ensure your dashboard always stays up to date.
Step 3: Select Metrics to Monitor
After setting up Competitors App, focus on the specific digital metrics relevant to your industry and business goals. Key metrics might include competitors’ website traffic, search engine rankings, social media engagement, content performance, and digital ad campaigns. These metrics help you understand how your competitors are performing online, giving you insights into their digital marketing strategies, SEO efforts, and customer engagement tactics. Tracking these areas will provide a clear view of their digital footprint and help you identify opportunities to improve your own online presence.
Step 4: Gather and Organize Data
Competitors App simplifies the process of gathering digital data by automatically collecting information from competitors’ websites, social media accounts, and online ads. This tool organizes the data into clear visual reports, allowing you to easily track metrics like keyword rankings, social media follower growth, and ad spend. By having all this data in one place, your competitor analysis dashboard becomes a powerful resource for quickly analyzing competitors’ digital strategies and adapting your own accordingly.
Step 5: Customize Your Dashboard
Once you’ve gathered the relevant data through Competitors App, the next step is to customize your competitor analysis dashboard. Tailor it to display the digital metrics that matter most to your business, such as SEO performance, social media engagement, and paid ad campaigns.
Use charts, graphs, and tables to visualize these insights clearly, so you can quickly assess competitor movements and trends. Customization allows you to prioritize the most actionable data, ensuring that your team can make informed decisions based on the most impactful digital activities of your competitors.
For example, here’s how you can filter to only see website changes or whatever categor you’d like to focus on.
Step 6: Regularly Update and Maintain Your Dashboard
A competitor analysis dashboard is only effective if it stays current. Fortunately, with Competitors App, the dashboard is automatically updated on a weekly basis, ensuring you always have the latest insights without needing to manually refresh the data.
This automation keeps you informed of any shifts in your competitors’ digital strategies, such as changes in SEO performance, social media engagement, or ad campaigns. Regular reviews of your dashboard will help you adapt your strategies quickly, ensuring you’re always equipped with up-to-date information to stay competitive.
Best Practices for Using Your Competitor Analysis Dashboard
1. Start Small and Scale Over Time
When setting up your competitor analysis dashboard, focus on a few key digital metrics first. This keeps things manageable and ensures you’re tracking the most important data. As you get comfortable, you can gradually add more metrics to build a more complete view of your competitors’ strategies.
2. Balance Depth and Breadth
It’s important to track a wide range of activities but also go deeper into key areas. For example, monitor broad metrics like website traffic, but dive deeper into specific insights like SEO rankings. This balance helps you get both a high-level view and detailed insights where it matters most.
3. Set a Regular Review Schedule
Establish a routine for reviewing your competitor analysis dashboard. Whether it’s weekly or monthly, having a consistent schedule ensures you’re always aware of any shifts in competitor strategies. Regular reviews help you stay proactive and adjust your tactics based on the latest insights.
4. Integrate Customer Feedback
Pair competitor insights with your own customer feedback to get a clearer picture of how to improve. Understanding how your competitors are performing is valuable, but aligning this with what your customers actually want gives you an edge in refining your products, services, and marketing efforts.
5. Use Technology to Streamline the Process
Take advantage of tools like Competitors App to automate data collection and tracking. Automation reduces the manual effort needed to gather competitor insights and ensures your dashboard stays up-to-date. This lets you focus on analyzing the data rather than spending time pulling it together.
6. Continuously Improve Your Competitor Analysis
Competitor strategies evolve, and so should your dashboard. Regularly refine and optimize your competitor analysis by adding new metrics or removing irrelevant ones. This ensures you’re always tracking the most important data and staying ahead of changes in your industry.
Types of Competitor Analysis Dashboards
1. Social Media Competitor Dashboard
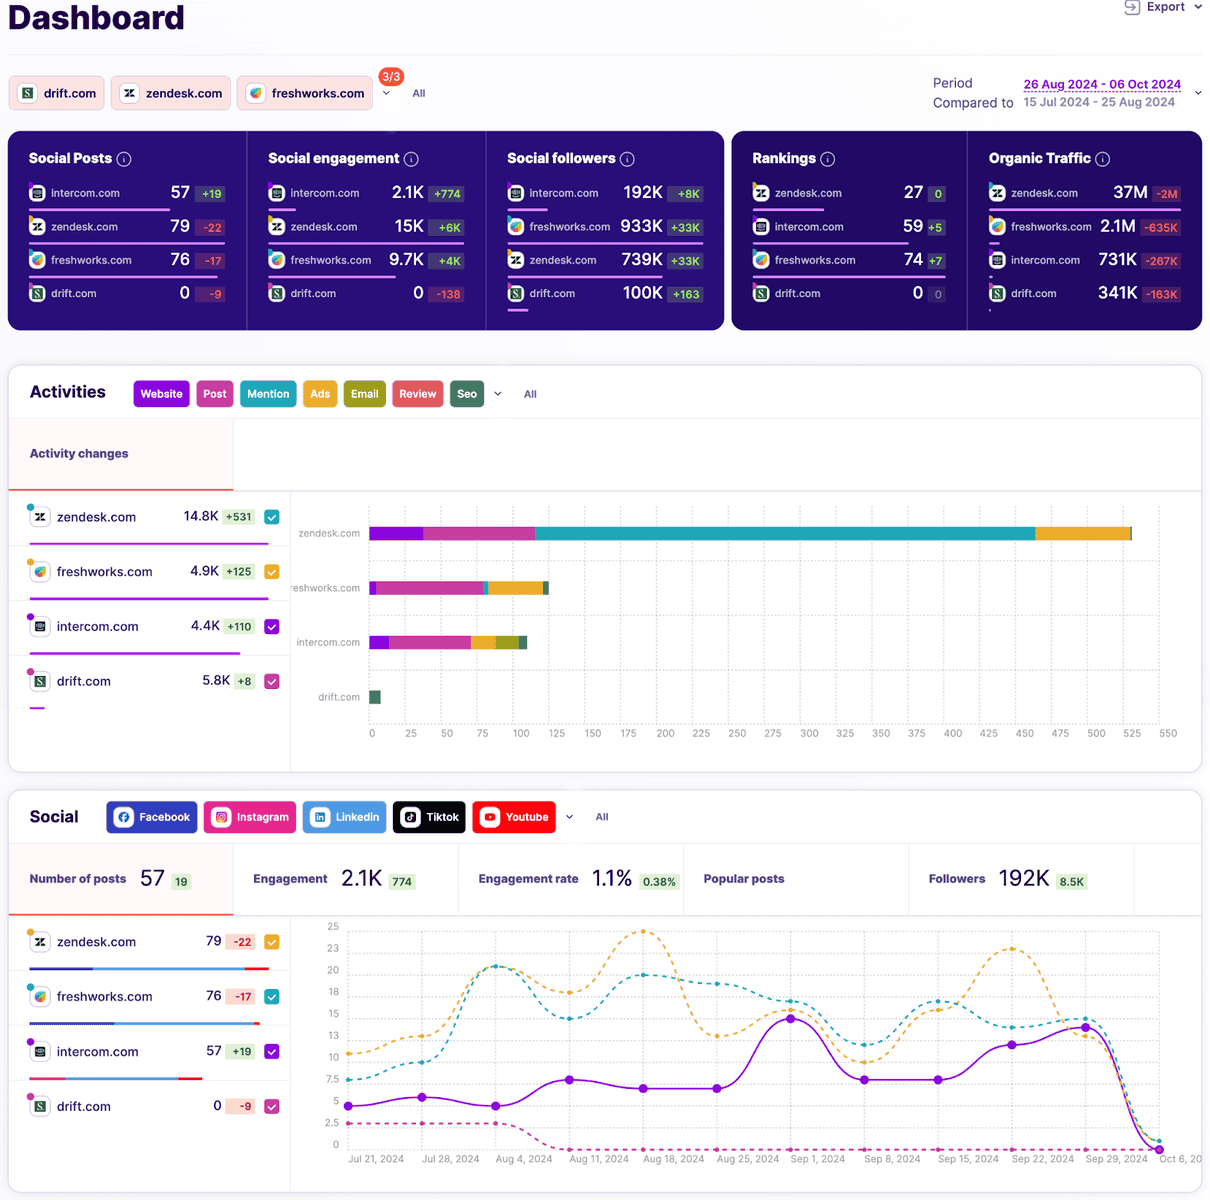
A social media competitor dashboard helps you monitor how your competitors are performing across various platforms like Facebook, Instagram, and LinkedIn. It tracks metrics such as follower growth, engagement rates, post frequency, and top-performing content. This data allows you to understand which strategies are resonating with their audience and adjust your social media efforts accordingly.
2. Product and Pricing Dashboard
A product and pricing dashboard focuses on tracking your competitors‘ product offerings and pricing strategies. This dashboard monitors changes in product features, pricing structures, and promotional offers. By keeping an eye on these elements, you can adjust your own product positioning and pricing to stay competitive in the market.
3. Sales and Win/Loss Dashboard
A sales and win/loss dashboard allows you to compare your sales performance directly against your competitors. It helps track metrics like win rates, customer acquisition, and deal sizes. This data is valuable for understanding where you’re gaining or losing to competitors, helping your sales team refine their approach and improve overall success rates.
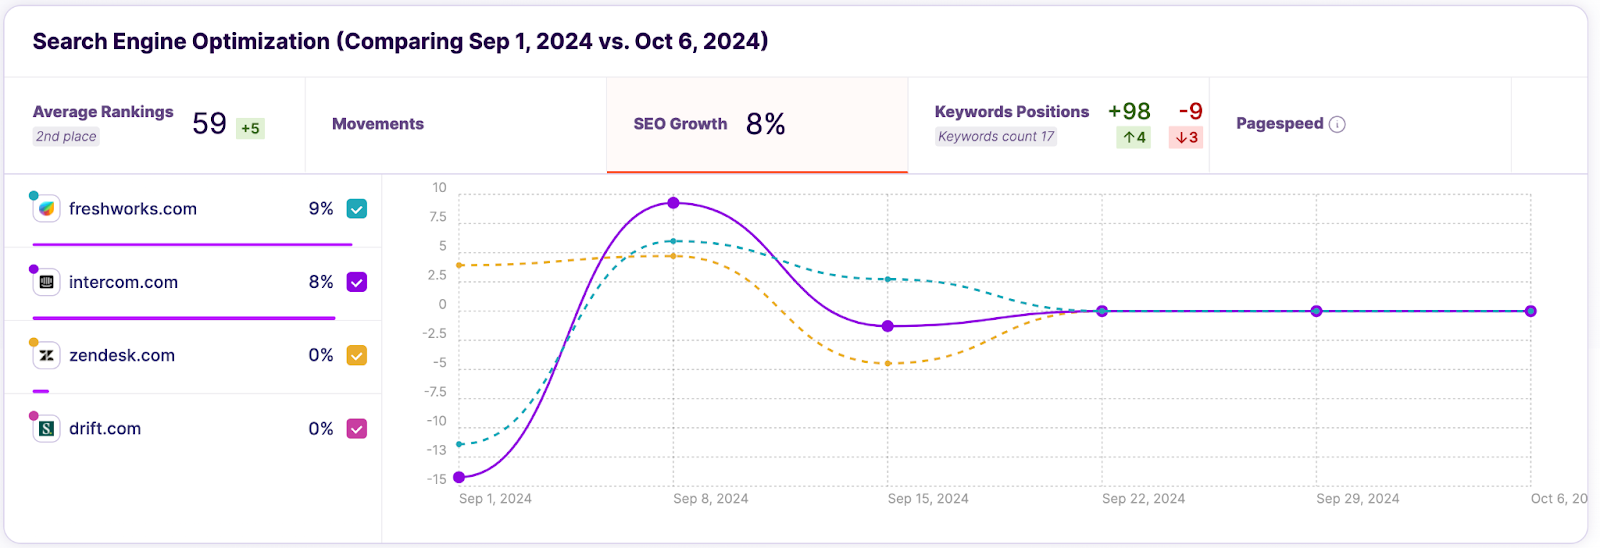
4. SEO and Keyword Performance Dashboard
An SEO and keyword performance dashboard tracks your competitors’ search engine rankings, backlink profiles, and keyword strategies. This allows you to analyze which keywords they are ranking for, the strength of their SEO efforts, and how their content performs in search results. Monitoring these metrics helps you optimize your own SEO strategy and identify gaps you can capitalize on.
5. Website Traffic and Engagement Dashboard
This dashboard focuses on tracking your competitors’ website performance, including overall traffic, bounce rates, and user engagement metrics such as time on site and page views. It also provides insights into how well their content is performing and which sources are driving the most traffic. Understanding these trends can help you improve your own website’s performance and user engagement.
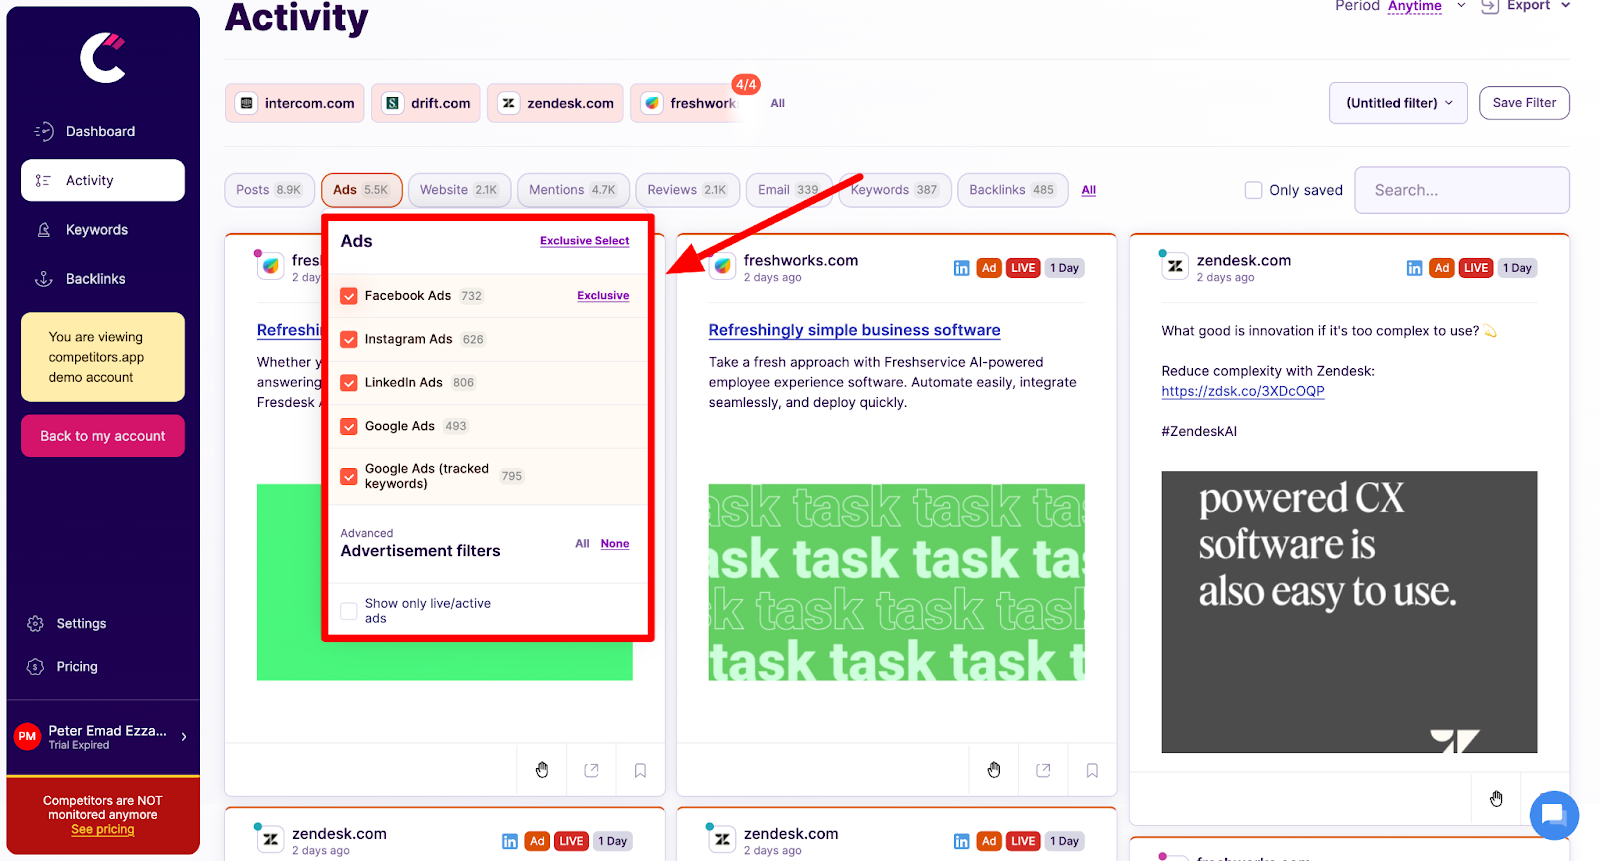
6. Paid Advertising Dashboard
A paid advertising dashboard provides insights into the ads your competitors are running across platforms like Google Ads, Facebook, and Instagram. It displays the ads themselves, including the CTAs, ad copy, and landing pages they are using. By reviewing these elements, you can gain a better understanding of their advertising strategies and create more effective ad campaigns based on what’s working in the competitive landscape.
Make the Most of Your Competitor Analysis Dashboard
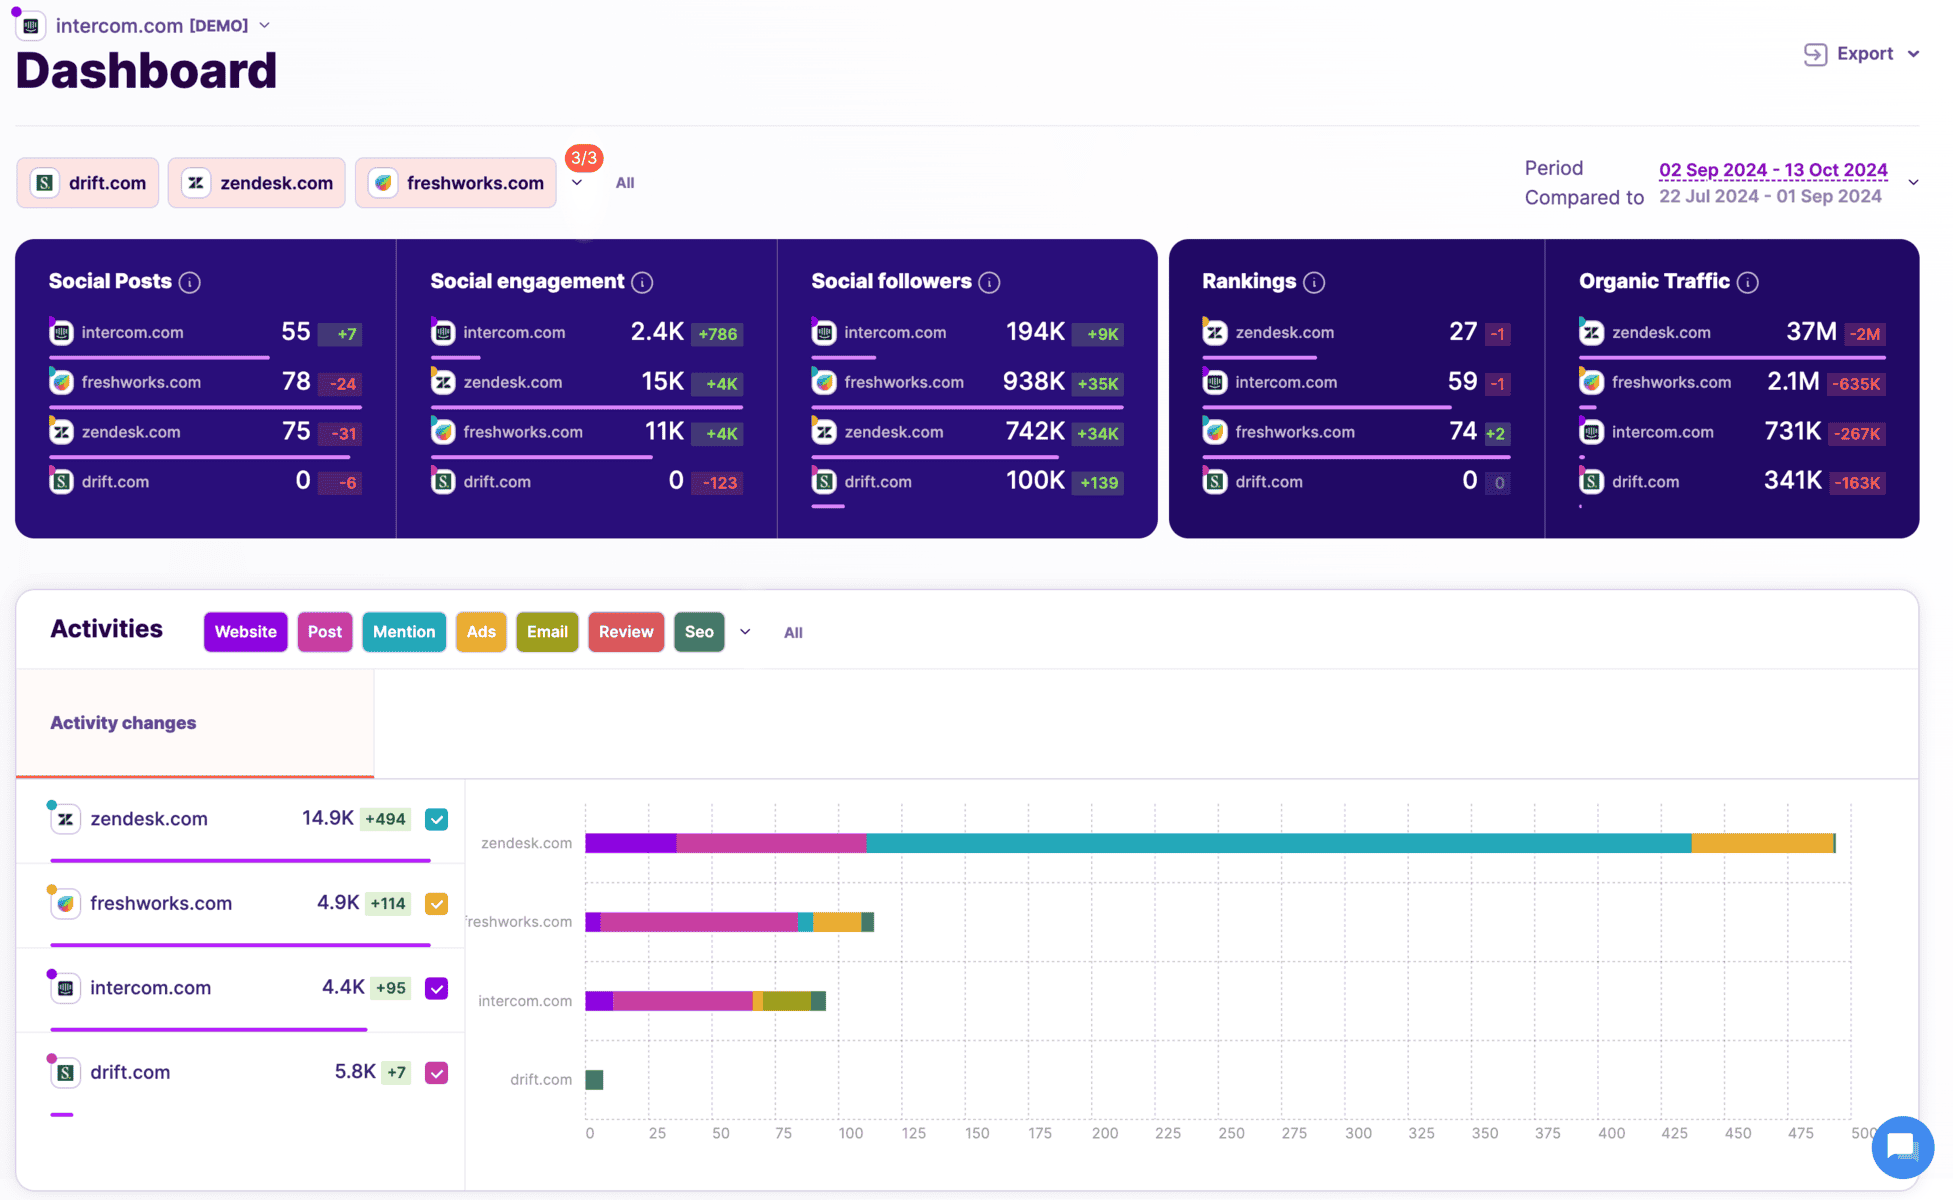
A competitor analysis dashboard is a crucial tool for any business looking to stay competitive in an ever-changing market. By tracking real-time digital insights about your competitors, such as social media activities, advertising strategies, and customer reviews, you can make data-driven decisions to refine your own approach.
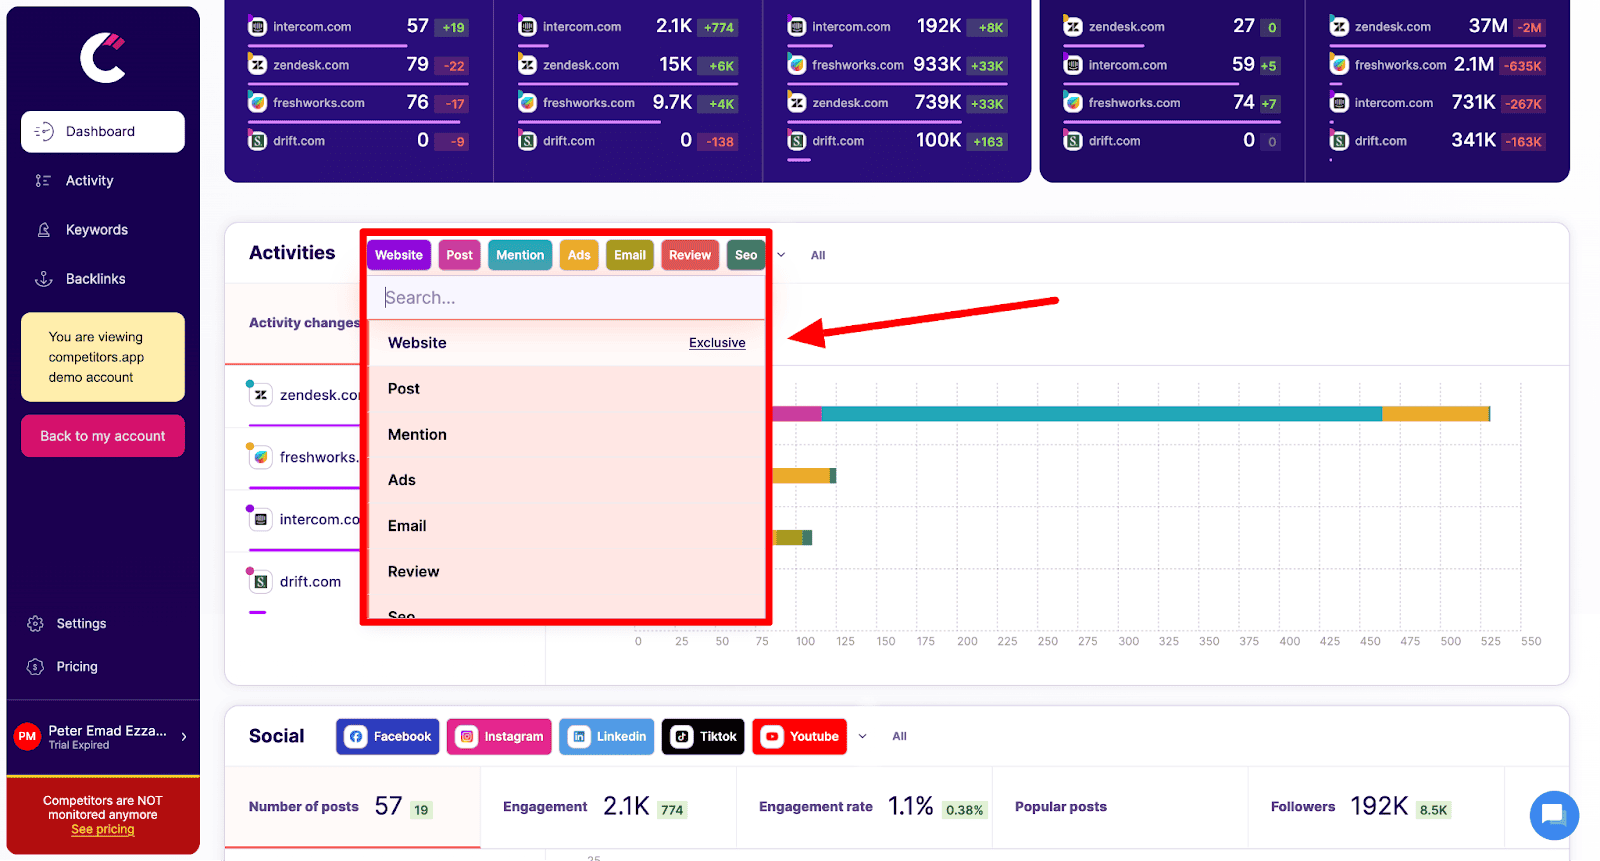
Using tools like Competitors App can help automate the process, keeping your dashboard up-to-date and relevant. Regularly reviewing and adjusting your dashboard ensures that you’re always one step ahead of the competition, allowing you to seize new opportunities and mitigate risks more effectively.
Frequently Asked Questions (FAQ)
1. What is the purpose of a competitor analysis dashboard?
A competitor analysis dashboard helps businesses track and analyze real-time data about their competitors in one centralized platform. It provides insights into key areas such as digital marketing strategies, product updates, pricing changes, and customer reviews, enabling you to make informed decisions to stay competitive.
2. What tools are best for building a competitor analysis dashboard?
Tools like Competitors App are great for automating competitor tracking and analysis. These tools gather data from various digital channels, including social media, paid ads, and website updates, providing you with a steady stream of competitor insights without manual effort.
3. What are the key metrics to track in a competitor analysis dashboard?
The most important metrics to track include social media performance, SEO rankings, website traffic, paid ads, and customer reviews. These digital metrics give you a comprehensive view of how competitors are performing online and help identify areas for improvement in your own strategy.
4. How often should I update my competitor analysis dashboard?
Ideally, your competitor analysis dashboard should be updated regularly to reflect real-time data. Using a tool like Competitors App, your dashboard can be automatically refreshed on a weekly basis, ensuring you always have the most up-to-date insights.
5. Can I use a competitor analysis dashboard for different departments?
Yes, different departments can benefit from a competitor analysis dashboard. Marketing teams can use it to monitor advertising and content strategies, product teams can track new product launches, and sales teams can gain insights from win/loss analysis. Tailoring the dashboard to specific departmental needs can improve decision-making across your organization.
6. What are the common mistakes to avoid with competitor dashboards?
Some common mistakes include tracking too many irrelevant metrics, not updating the dashboard frequently enough, and failing to take action on the insights gained. It’s important to focus on the most impactful data and ensure the dashboard is regularly maintained to remain valuable.