Managing multiple social media accounts can be challenging, especially when you need to track both your performance and that of your competitors across various platforms. This is where a free social media dashboard becomes invaluable. It not only allows you to monitor your own channels in one place but also enables you to track competitor activity in real time.
With tools like Competitors App, you can compare metrics like engagement rates, follower growth, and content performance, giving you deeper insights into your industry landscape.
Whether you’re a small business owner or a social media manager, a dashboard that integrates competitor analysis can save time, offer real-time insights, and empower you to make more informed, data-driven decisions. In this guide, we’ll dive into everything you need to know about free social media dashboards, including how to build one and the best tools available.
What is a Social Media Dashboard?
A social media dashboard is a centralized tool that helps businesses and marketers track, monitor, and analyze data from all their social media accounts in one place. Rather than switching between platforms like Facebook, Instagram, LinkedIn, or X, a social media dashboard provides a comprehensive view of your metrics in real time.
These dashboards enable users to track key performance indicators (KPIs) such as engagement, follower growth, traffic, and conversions, making it easier to measure the success of your campaigns.
The importance of tracking social media metrics lies in understanding what works and what doesn’t, allowing you to make informed adjustments to your strategy. From tracking how well your content resonates with your audience to identifying trends that can be capitalized on, a social media dashboard simplifies the process of data collection and interpretation. This becomes especially crucial for businesses looking to fine-tune their efforts and improve ROI across platforms.
How to Build a Free Social Media Dashboard Using Competitors App

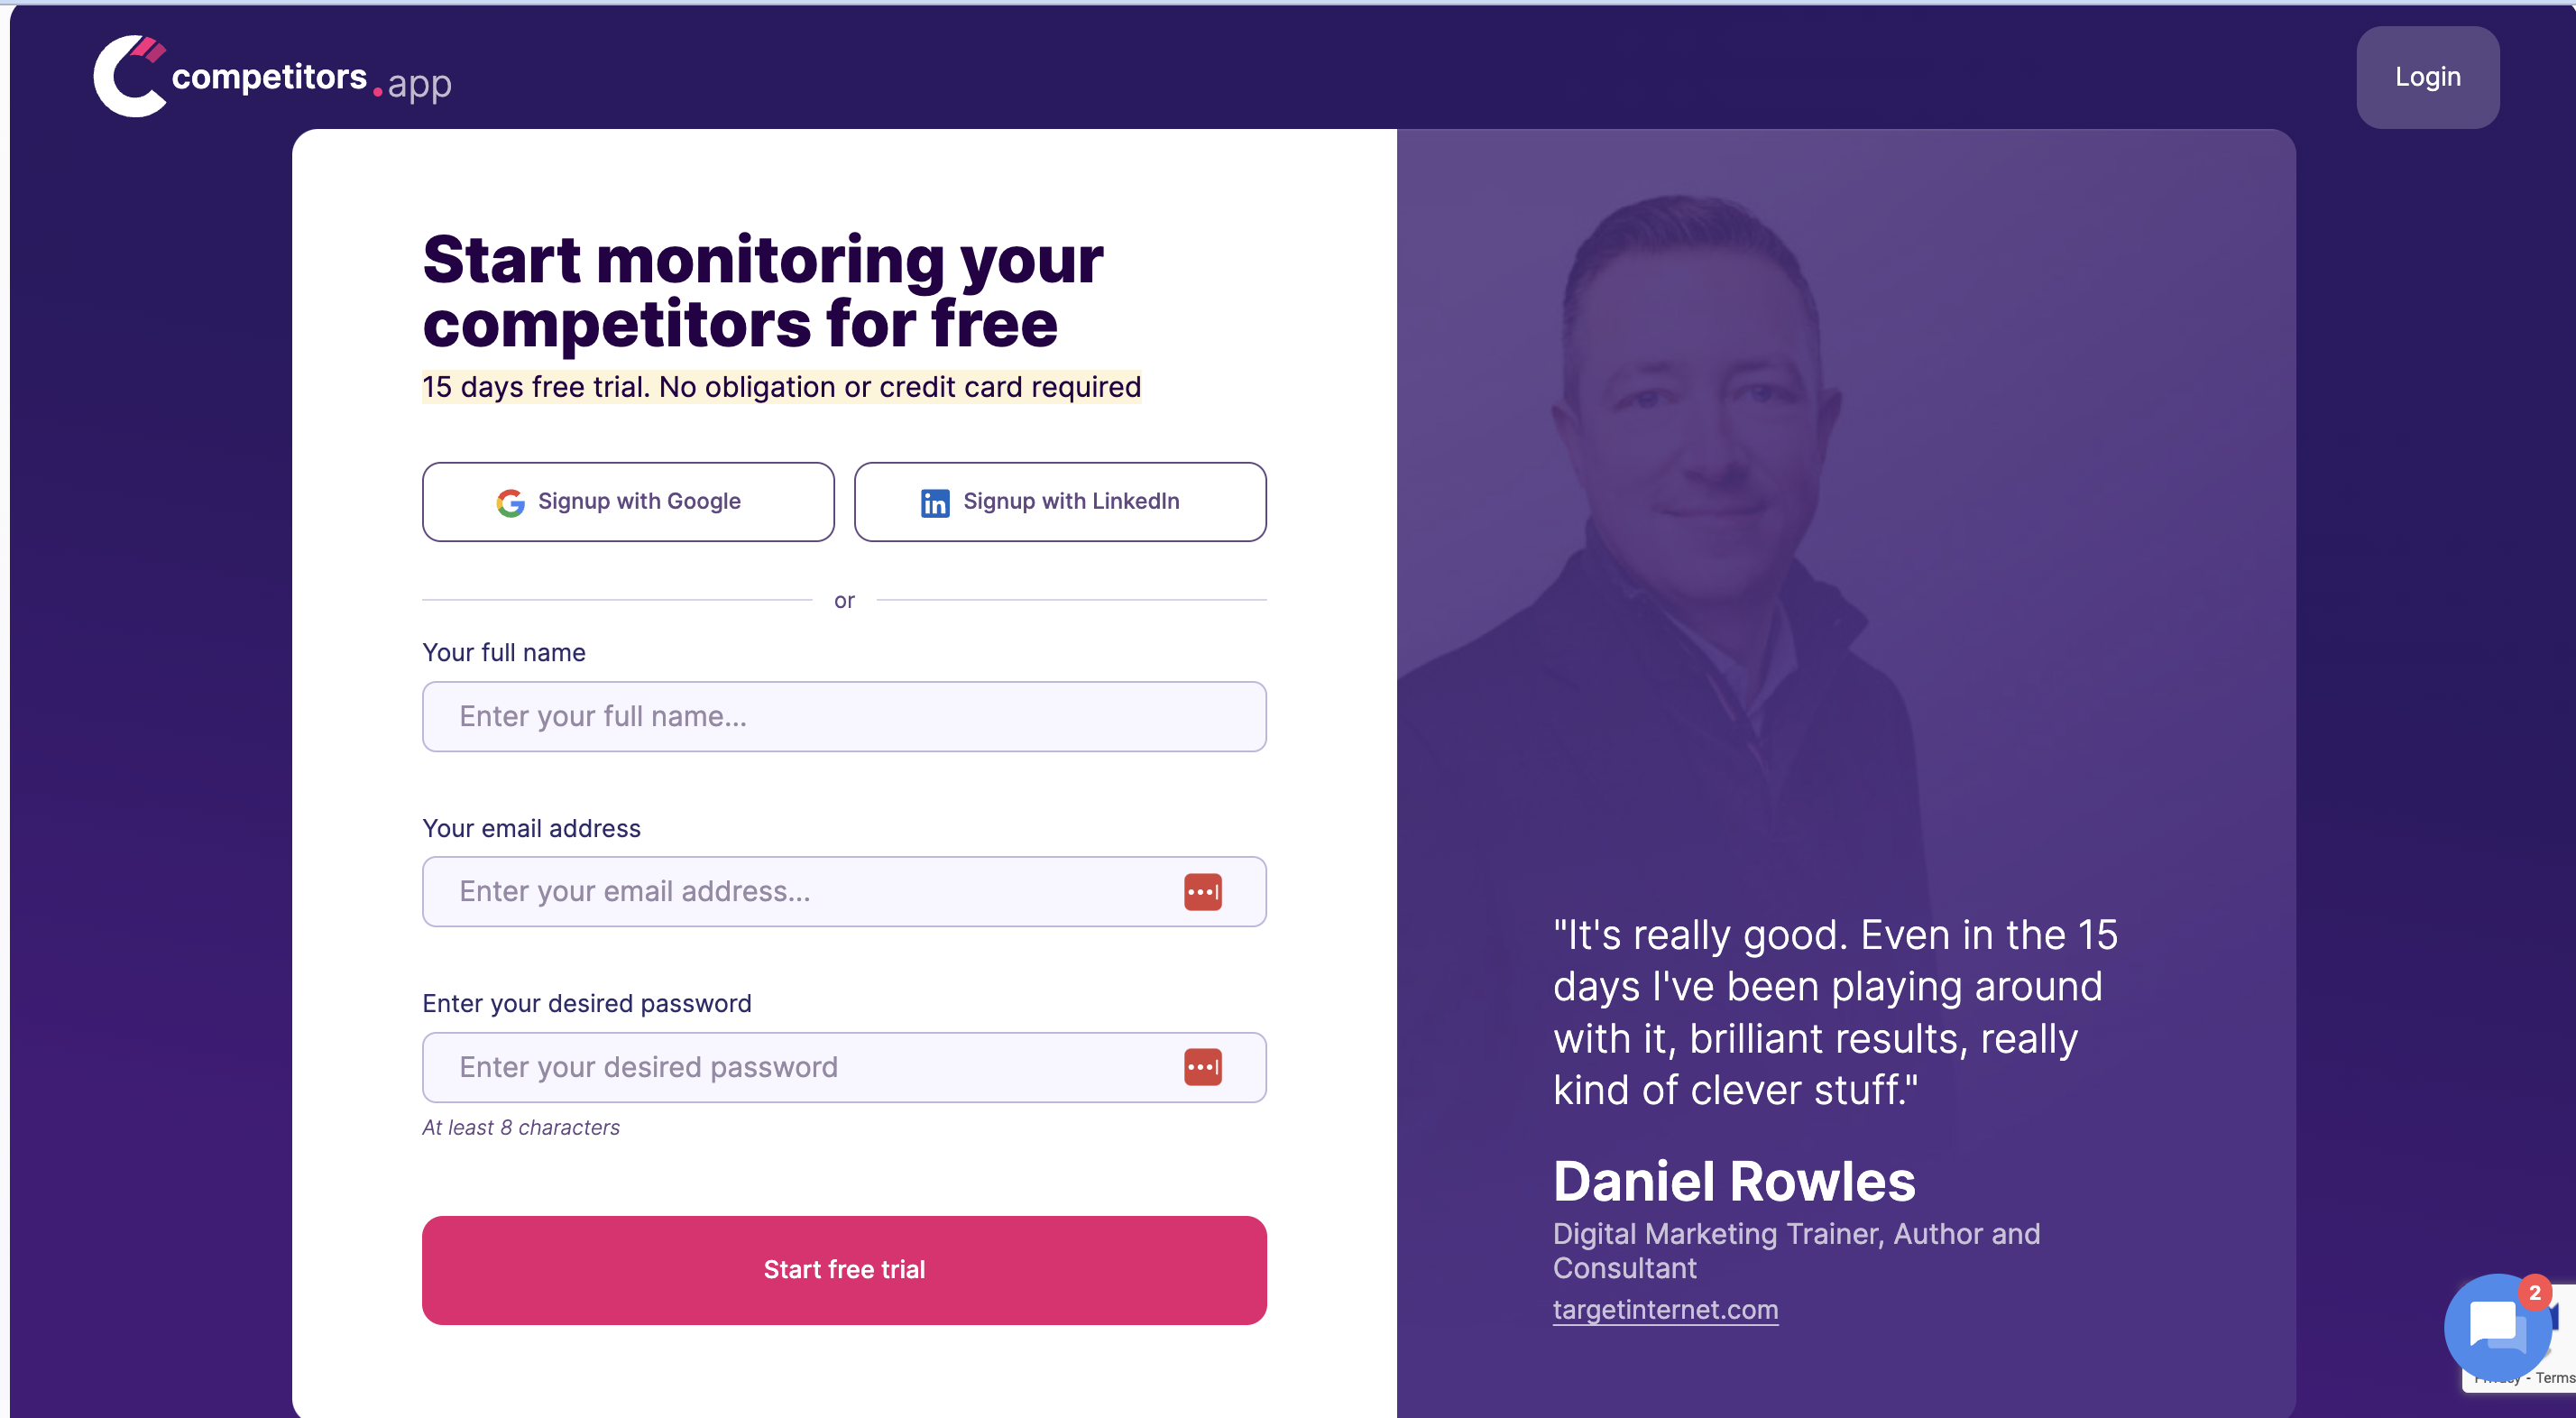
1. Sign Up and Set Up Your Account
First, create an account on Competitors.app. You'll need to provide some basic information about your business and your competitors. The setup process is straightforward and user-friendly.

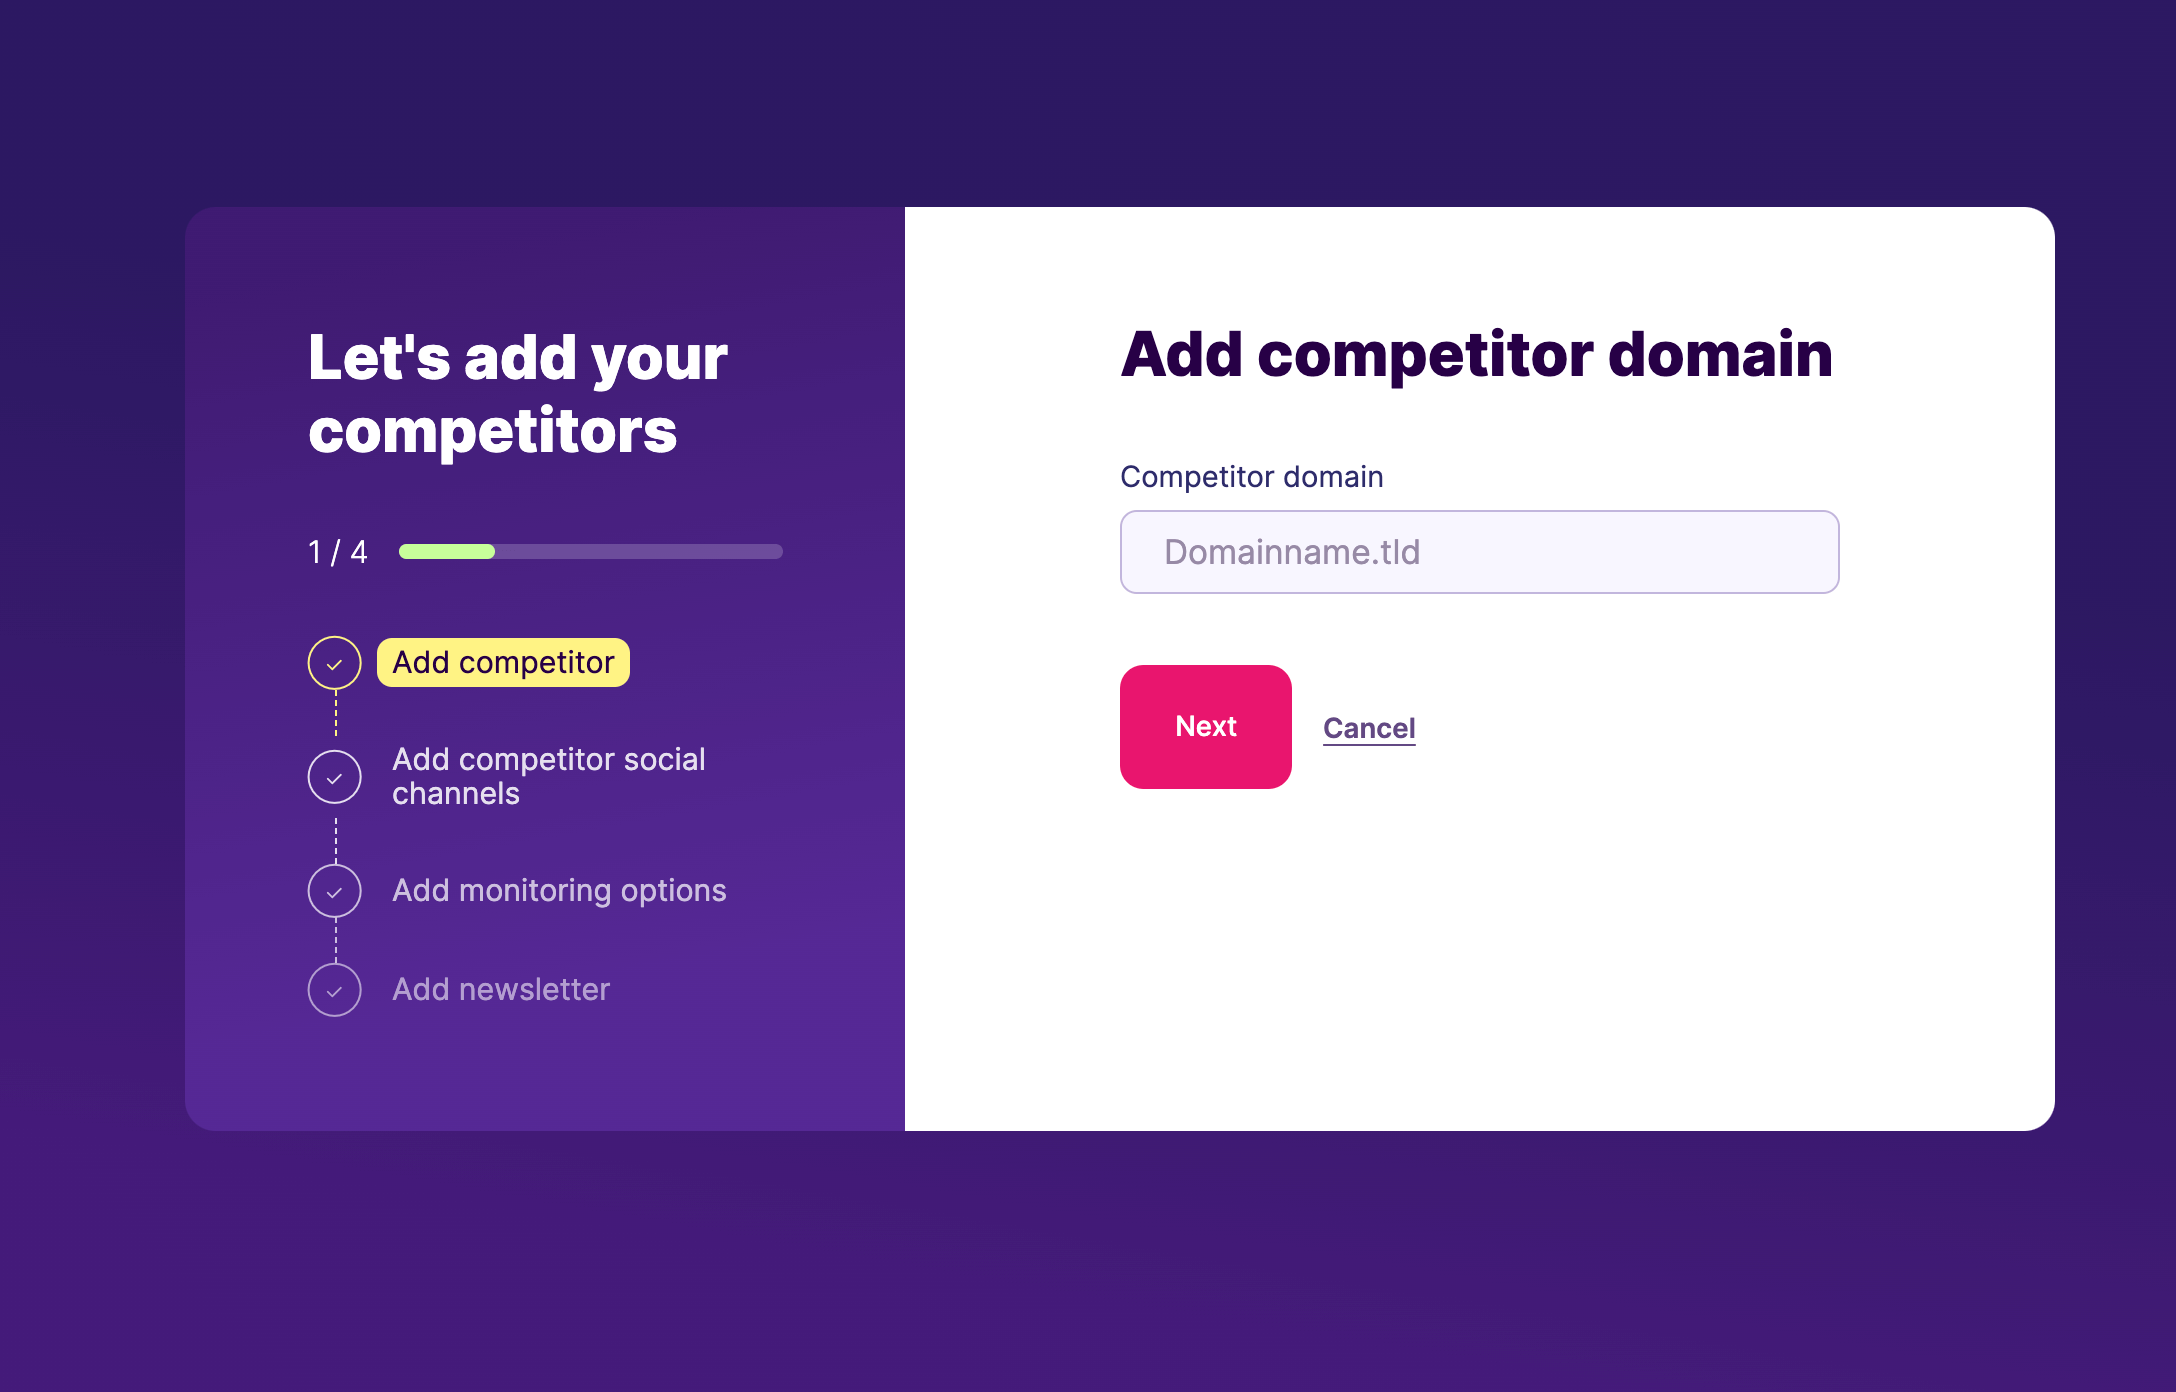
2. Add Your Competitors
Once your account is set up, add the competitors you want to analyze. You can usually do this by entering their website URLs. Competitors.app allows you to track multiple competitors, giving you a comprehensive view of your competitive landscape.

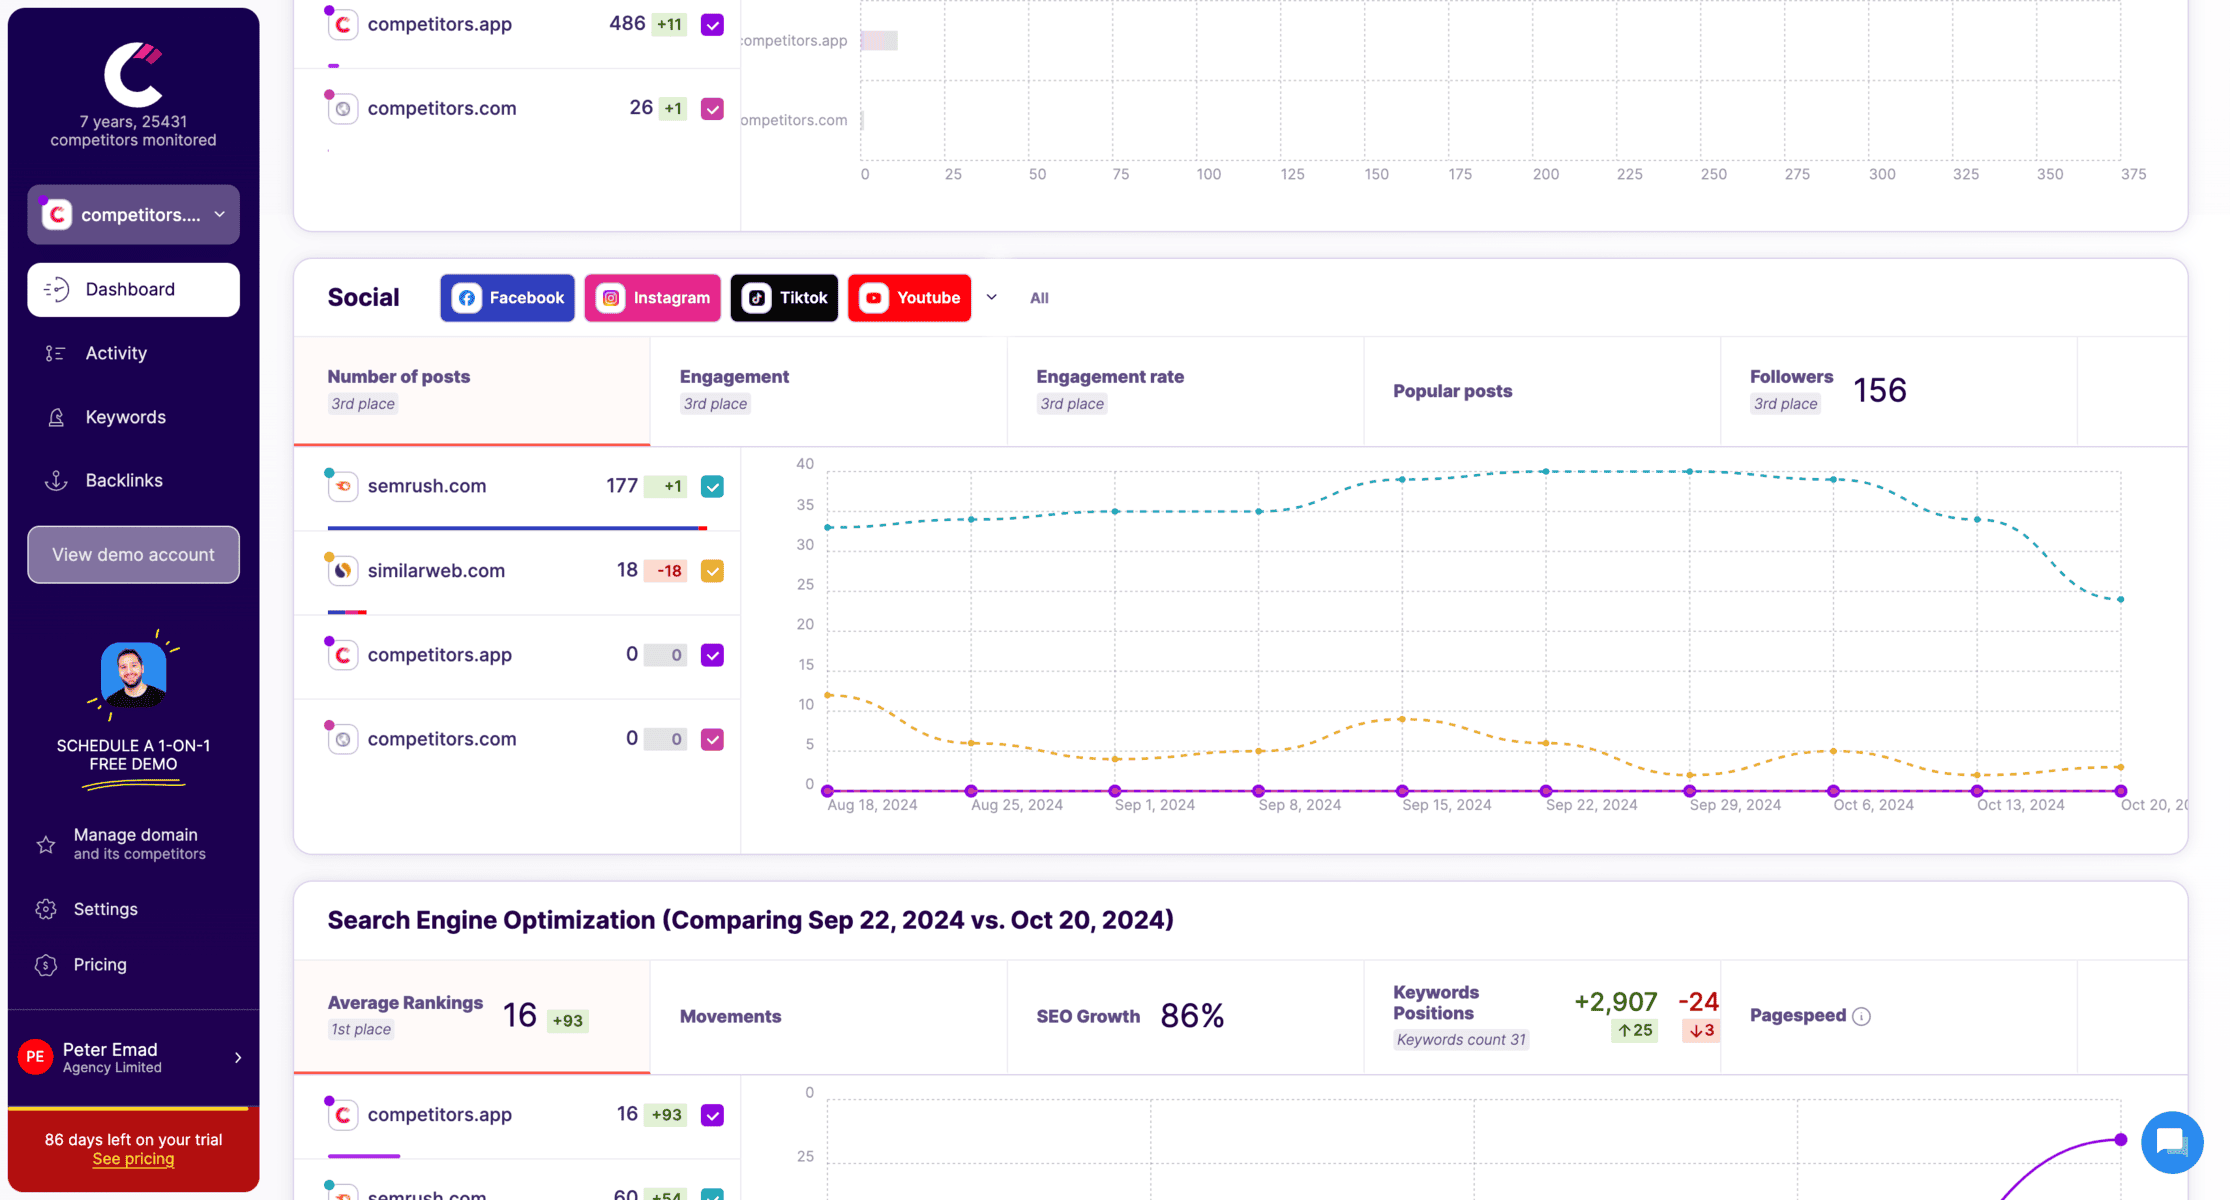
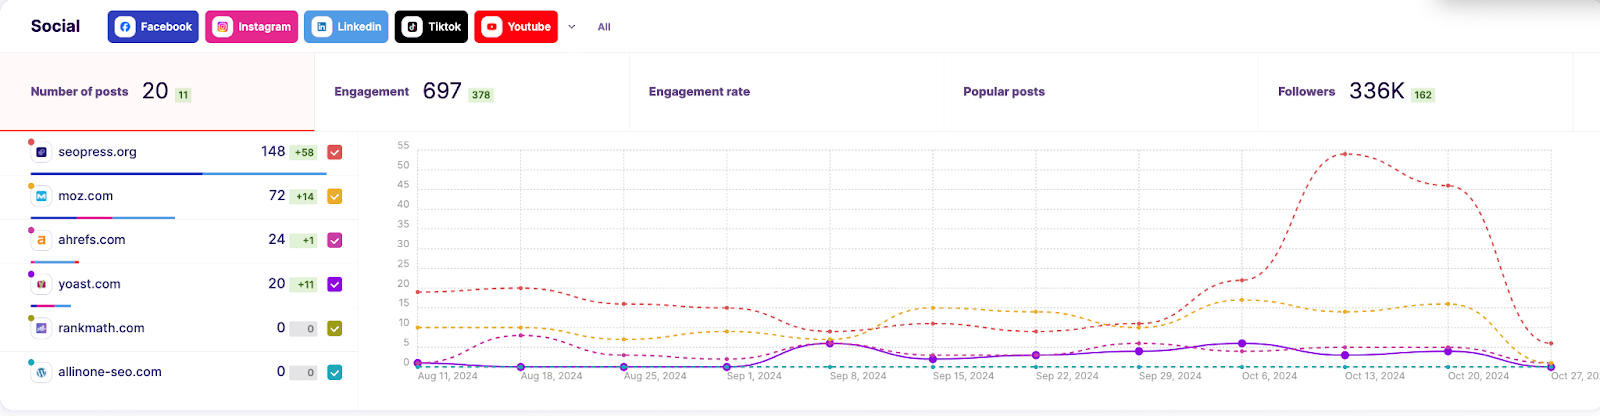
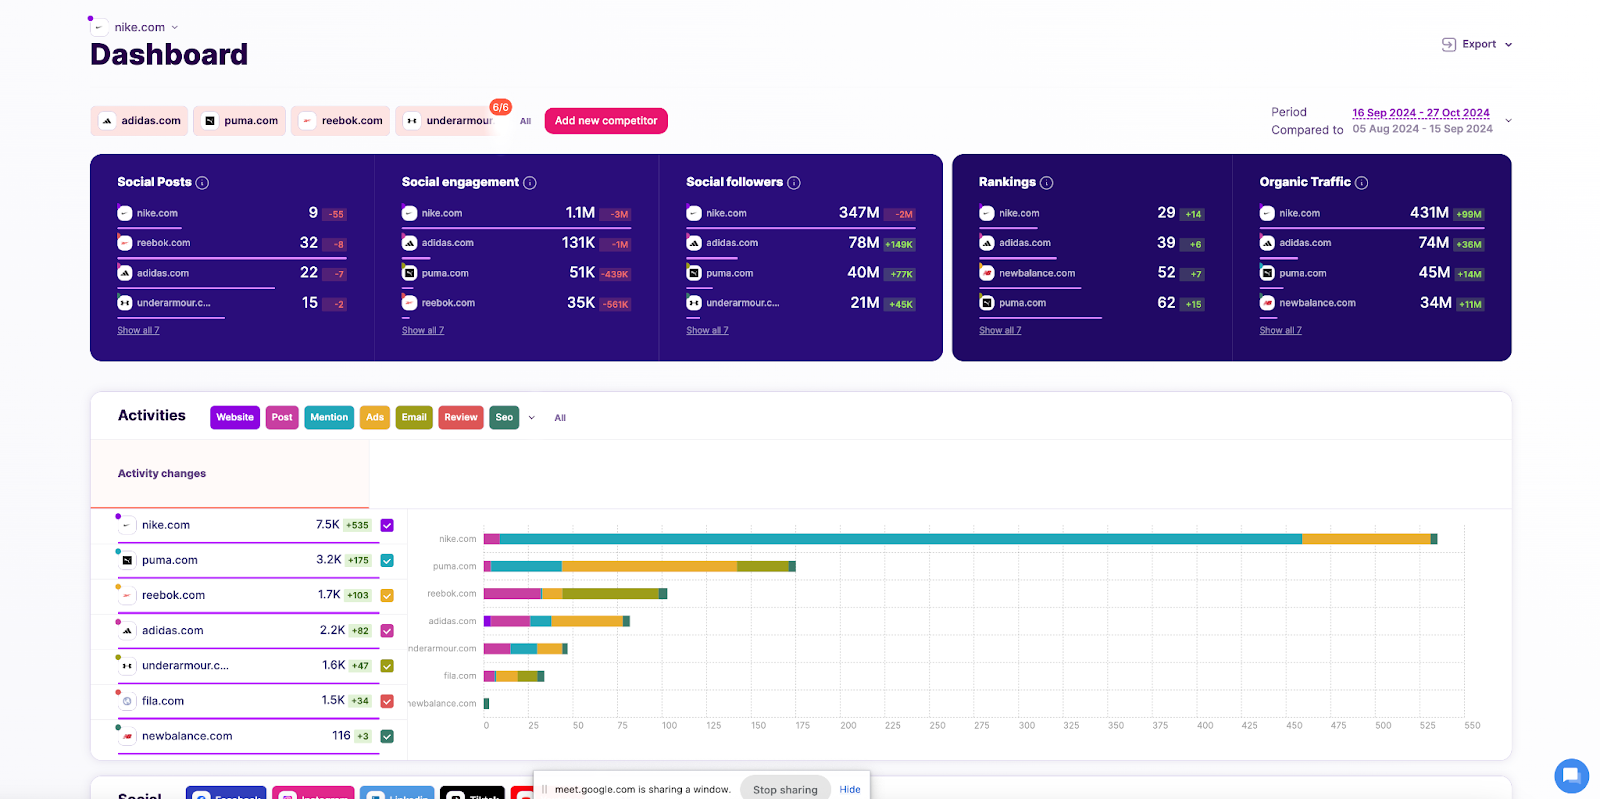
3. Scroll to the Social Section in the Dashboard Page
Scroll to the bottom of the dashboard till the "social" section. In this section, you'll find the numbers of posts your competitors posted, their top posts, their new followers count and their engagement rate.

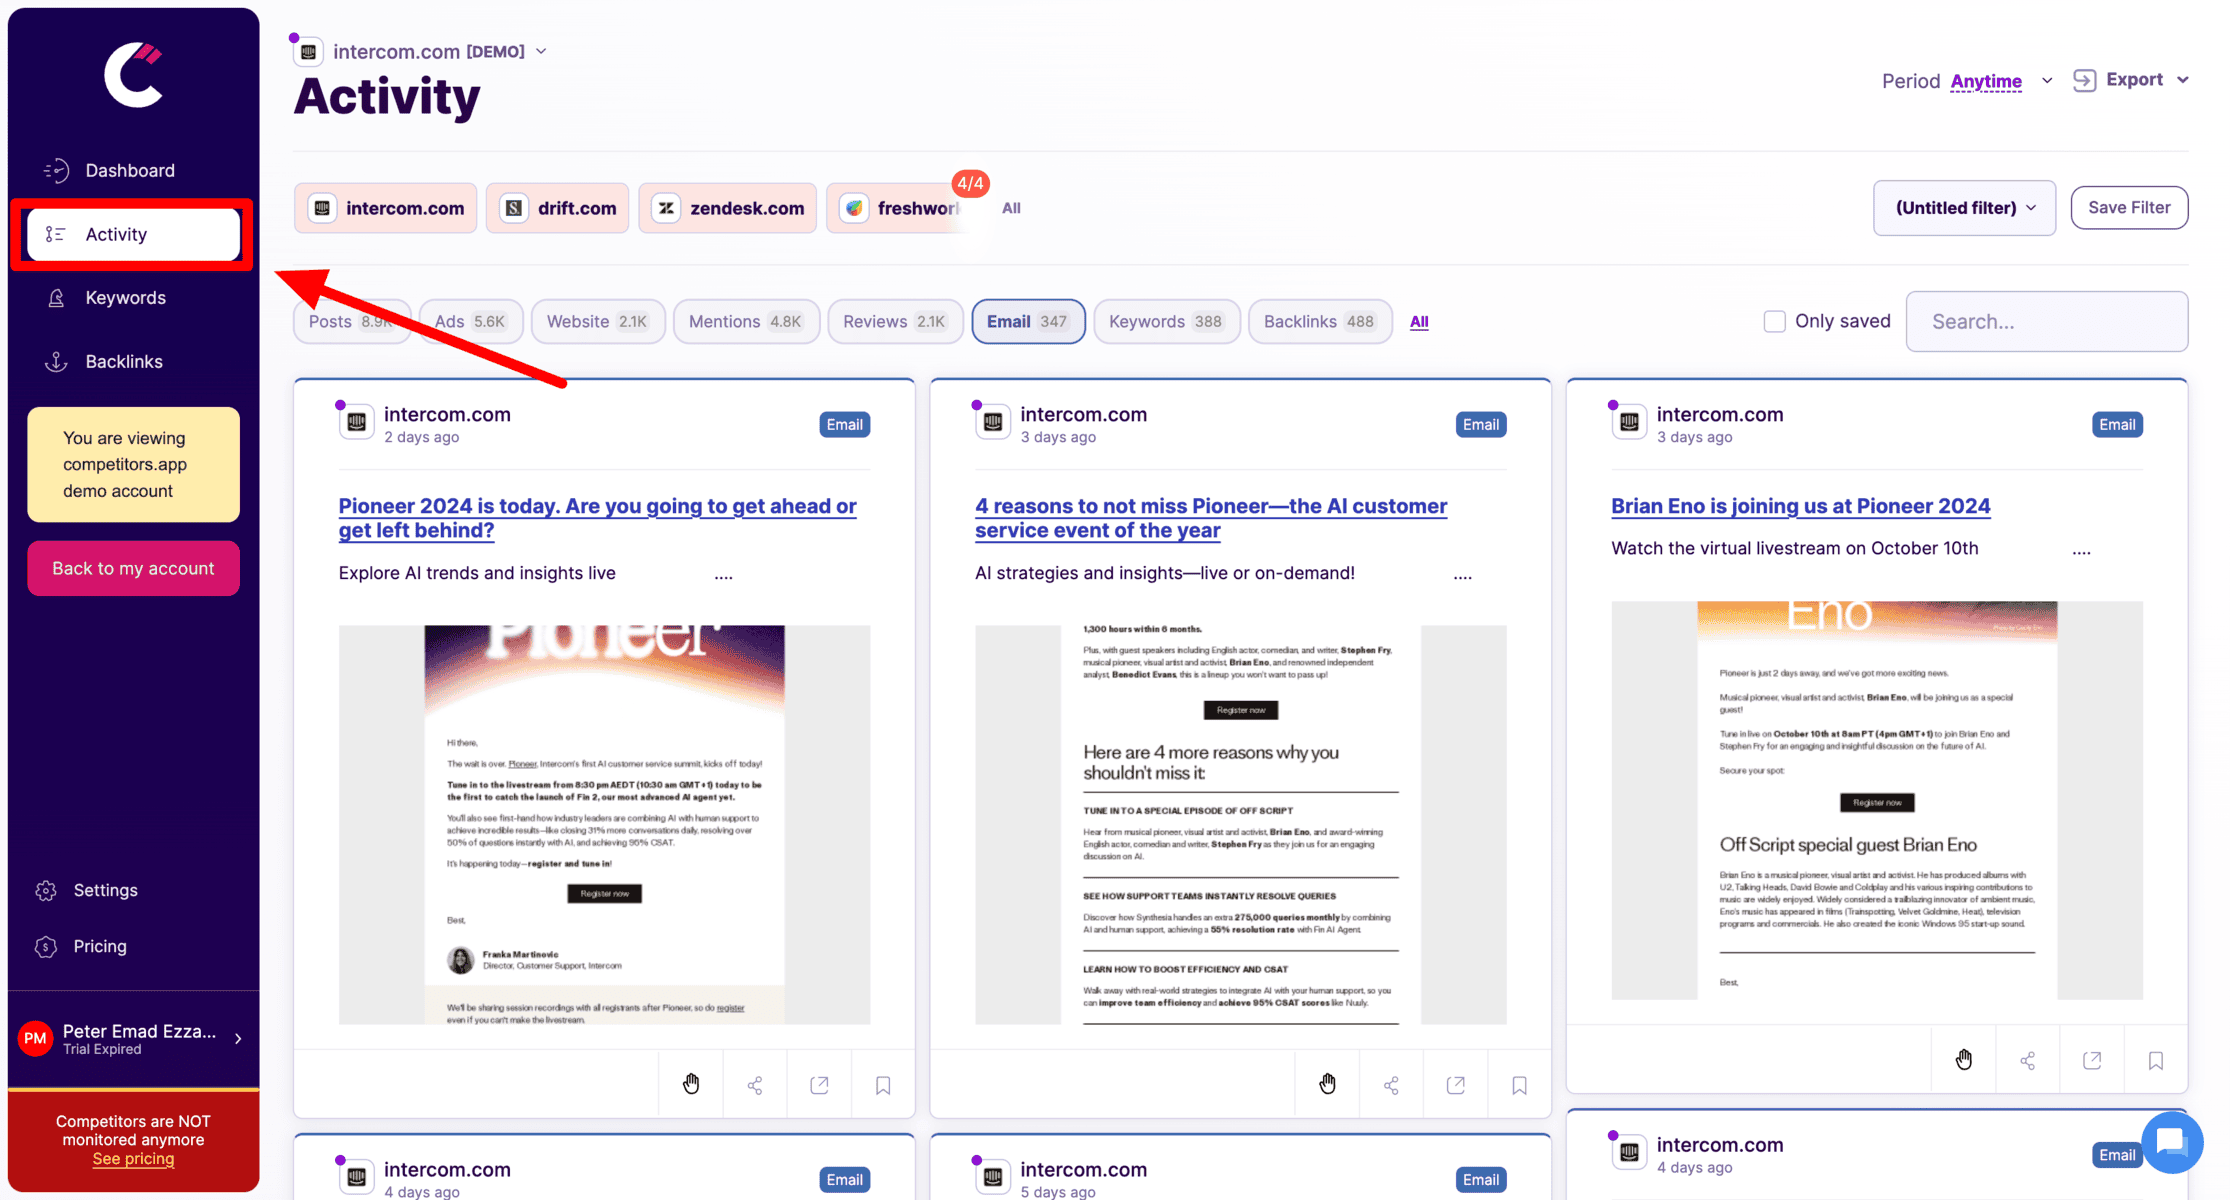
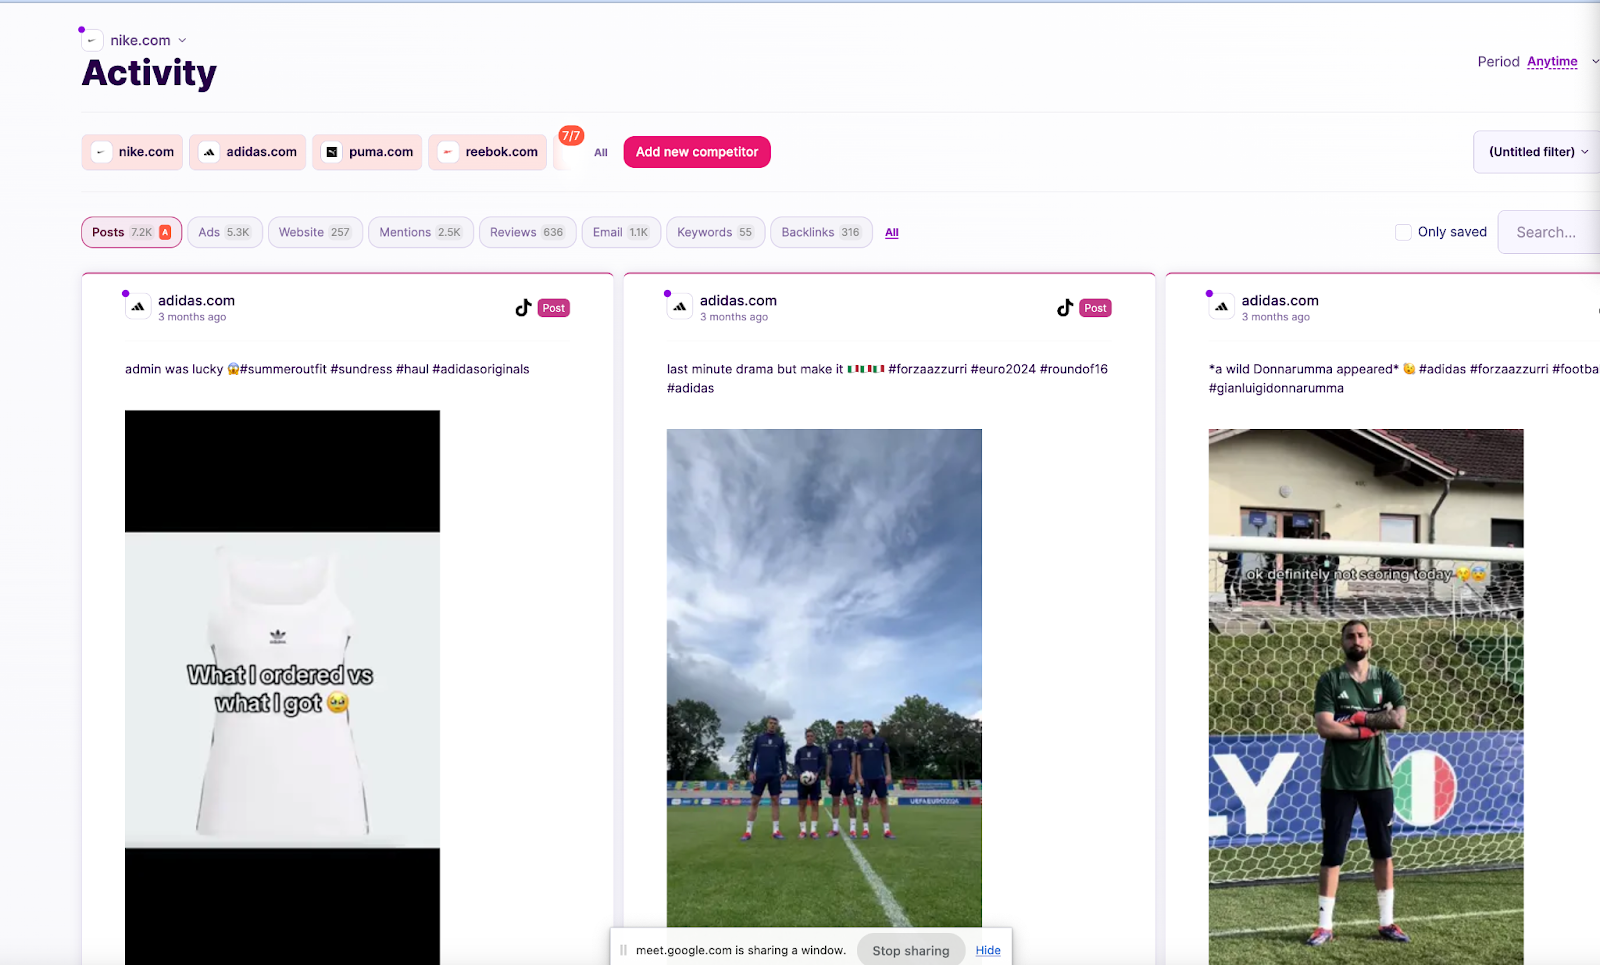
4. Navigate to the Activity Section
From the left sidebar, click on the "activity" section. This will take you to a page that shows all the data about your competitors, from paid ads, website changes, email marketing activities, social media activities to even their SEO performance.
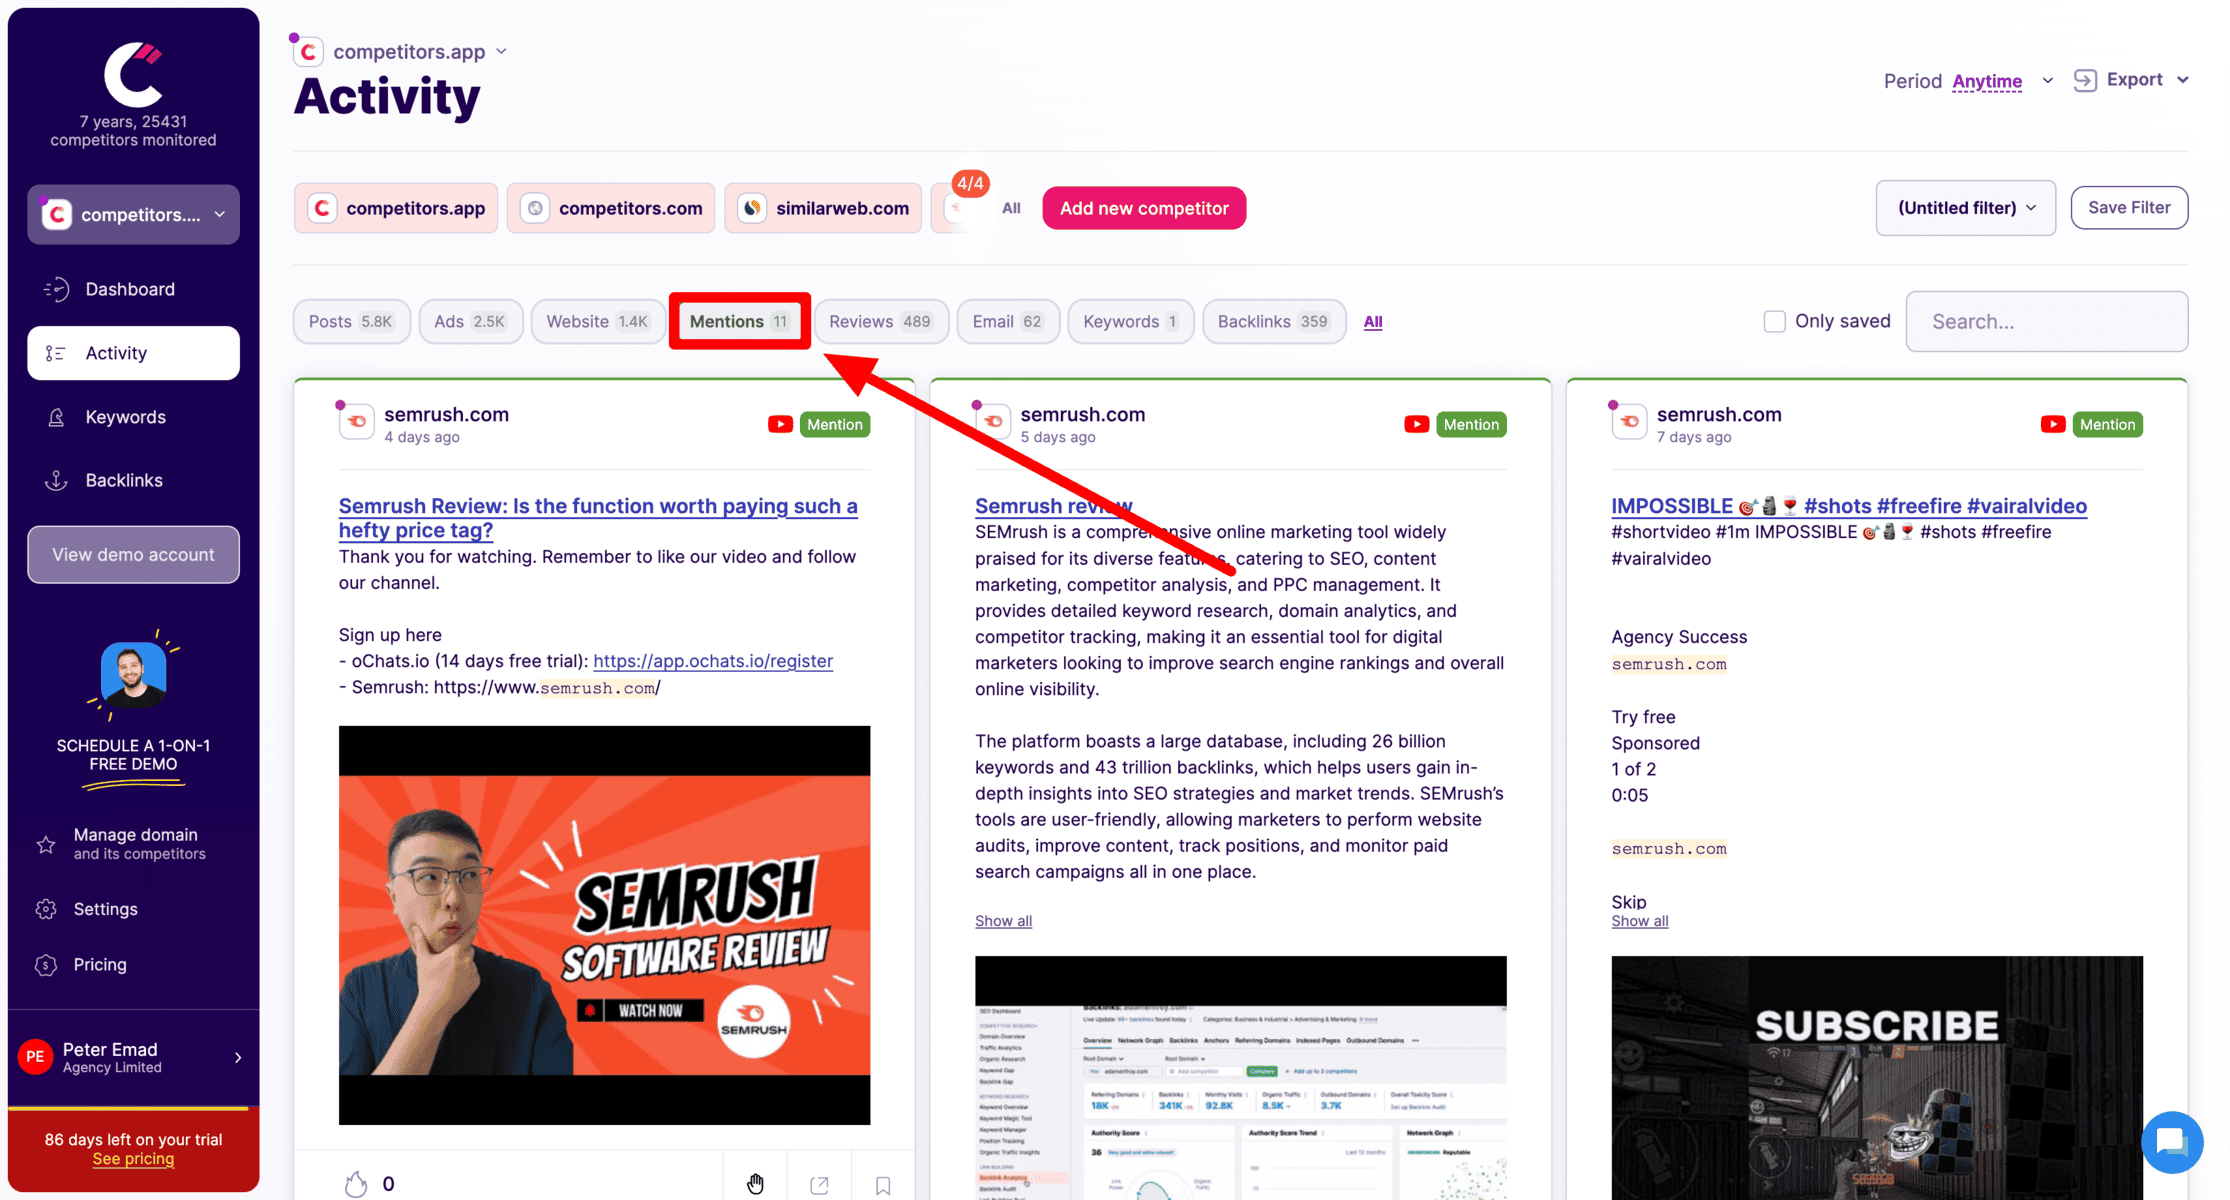
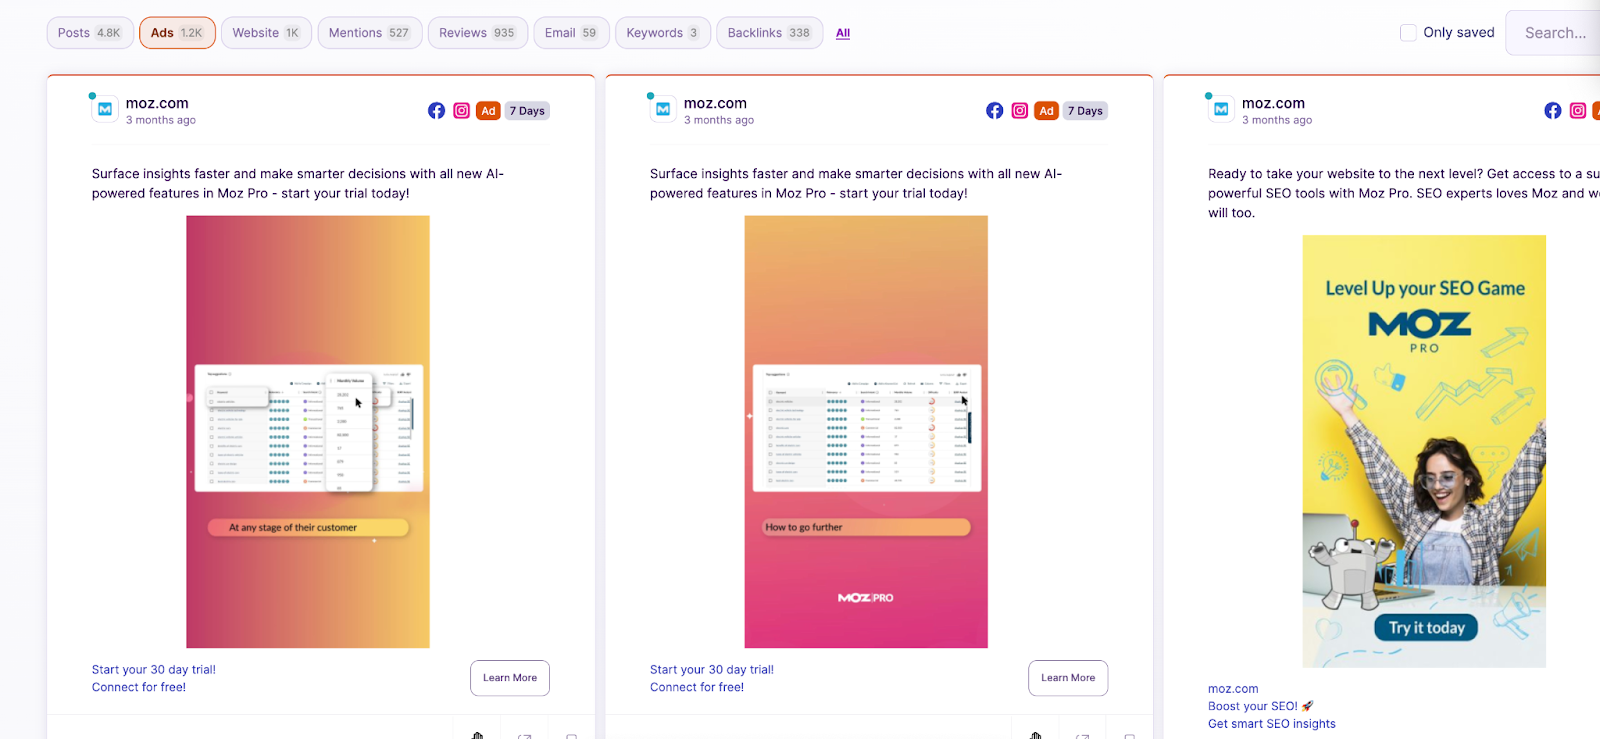
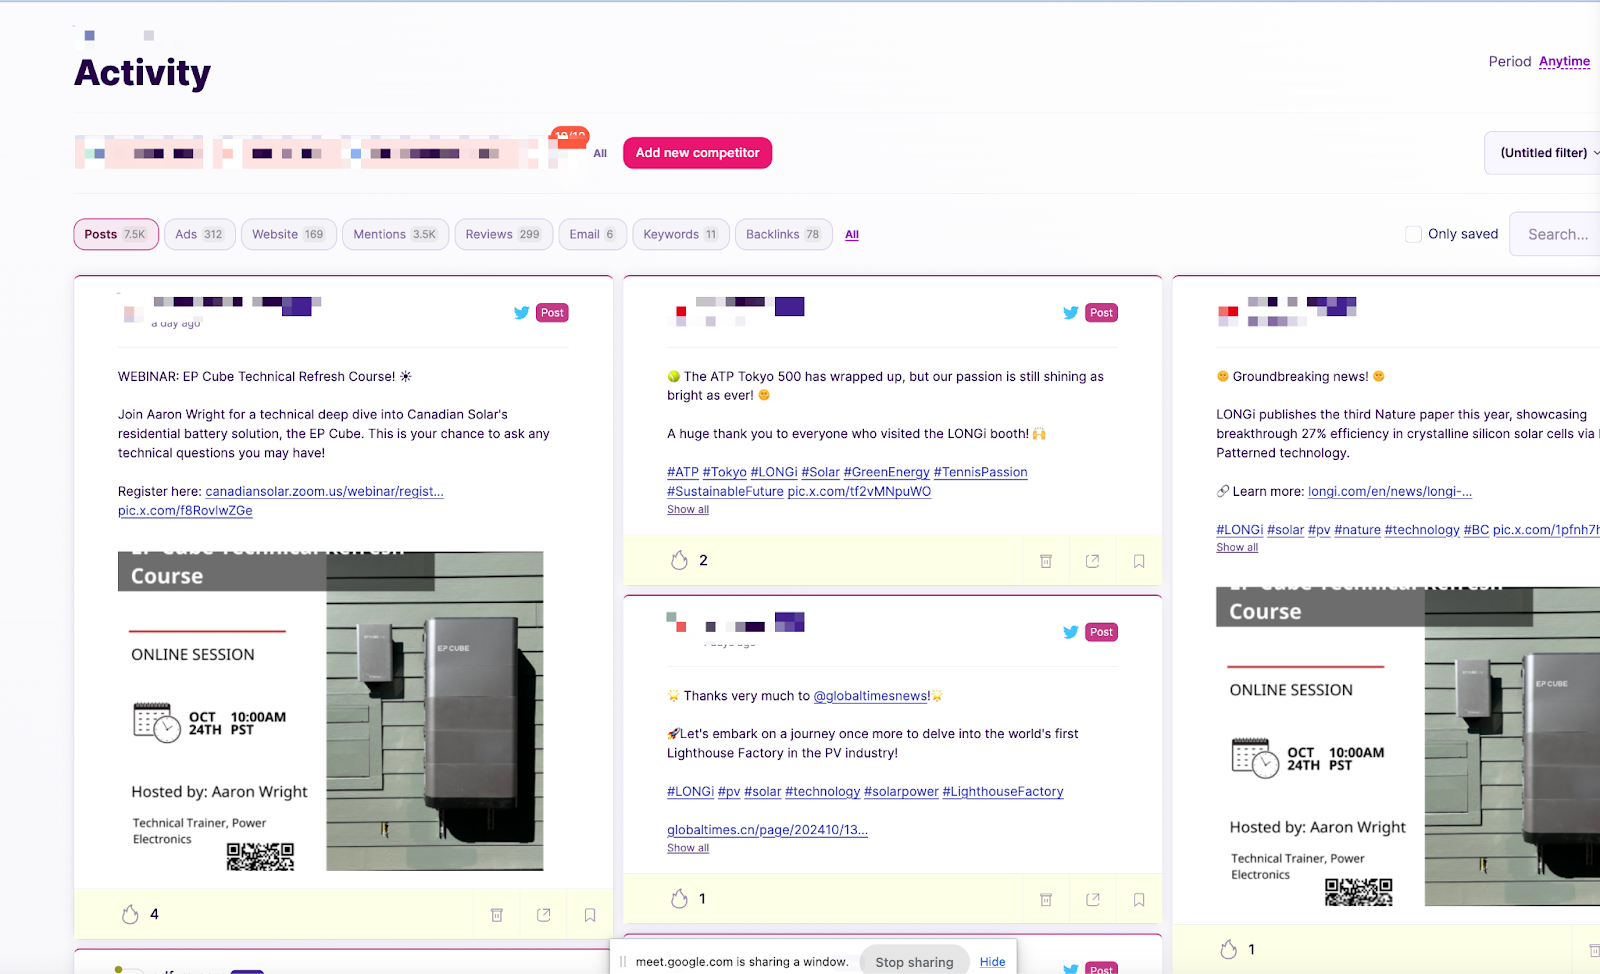
5. Select Posts
To get a more in-depth analysis, select "posts". This will show you all the posts your competitors have posted over a specific period of time.
This will show you the amount of engagement on each post in detail.

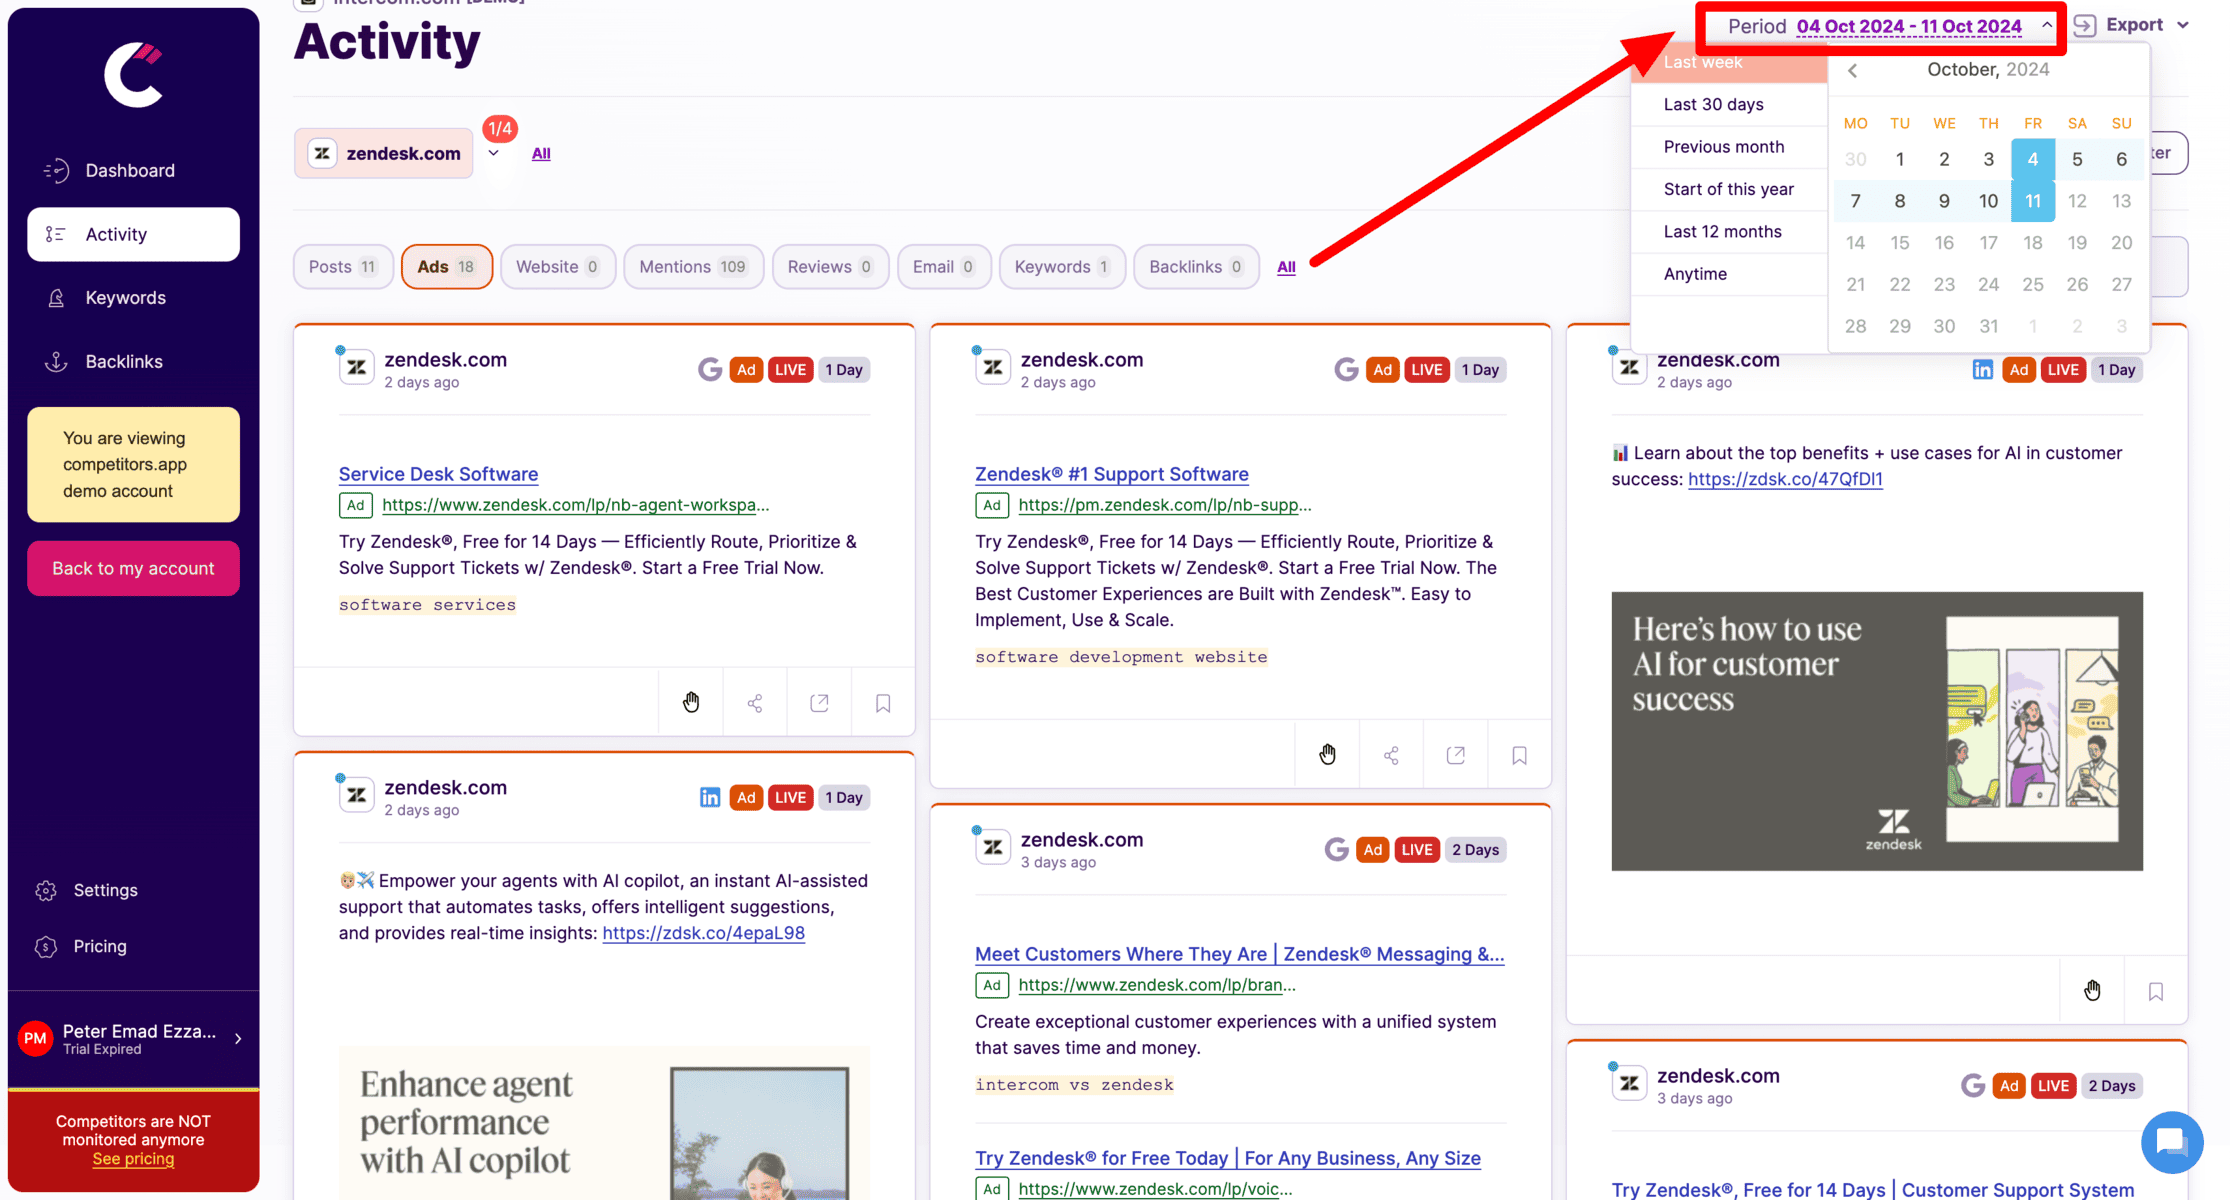
6. Filter by Date Range
You can also filter by specific date range, such as a specific week, month or even a day. This feature allows you to see yours or your competitors' posts and social media activity over a specific period of time.
Why You Need a Social Media Dashboard for Real-Time Monitoring and Automated Reporting
A social media dashboard serves multiple purposes that can dramatically improve your social media management. These are the four main reasons why it’s essential:
- Increased Efficiency: By consolidating all your social media data in one place, a dashboard eliminates the need to switch between platforms. This centralization allows you to easily monitor performance and track important metrics like engagement, follower growth, and conversions without wasting time gathering data manually.
- Real-Time Monitoring: One of the most important features of a dashboard is the ability to track metrics in real time. This gives you instant insights into trends and issues as they happen, allowing you to respond quickly. Whether it’s a spike in engagement, a negative comment, or an emerging trend, real-time visibility enables you to adjust your strategy and seize opportunities immediately.
- Automated Reporting: Dashboards can be set up to automatically generate reports, saving significant time and effort. Instead of manually compiling data from each social platform, automated reporting delivers accurate and timely insights with minimal effort. This feature is particularly useful for agencies and businesses that need to regularly share performance updates with clients or stakeholders, ensuring reports are always consistent and error-free.
- Improved Decision-Making: With instant access to real-time data and automated reports, social media managers are better equipped to make informed, data-driven decisions. This can help in refining your content strategies, allocating resources more effectively, and optimizing campaigns based on what’s performing best.
Essential Metrics to Include in Your Social Media Dashboard
When setting up a social media dashboard, including the right metrics is crucial for understanding your overall performance. Here are some of the most important ones:
- Social Media Engagement: This metric covers likes, comments, shares, and other interactions across your social media posts. It’s a direct indicator of how well your content resonates with your audience. Tracking engagement helps identify which types of posts, such as videos or infographics, are most effective in capturing attention and driving conversations.
- Followers/Subscribers: The growth rate of followers or subscribers across platforms like Instagram, Facebook, and LinkedIn provides insights into your audience expansion efforts. Tracking this metric, alongside follower demographics, helps determine if you’re reaching the right people and expanding into new target markets.
- Traffic from Social Media: Measuring how much traffic your social media channels drive to your website is key for understanding the effectiveness of your social media efforts. Tools like Google Analytics can show how much of your web traffic originates from social media, as well as the user behaviors once they land on your site.
- Conversions and Revenue: This metric ties directly to your return on investment (ROI) from social media marketing. Whether it’s direct product purchases, lead generation, or sign-ups, tracking conversions helps measure the real impact of your social media activities on business goals.
- Content Performance: Monitoring which posts, videos, or ads perform best across platforms allows you to continually refine your content strategy. By identifying trends in high-performing content, you can replicate similar approaches to achieve better results.
- Audience Insights: Demographics, location, and interests of your audience offer deeper insights into who is engaging with your content. This allows for more targeted content creation, ensuring you speak to the right audience segments effectively.
- Competitor Insights: Using tools like Competitors App, you can track your competitors’ activities, including their engagement rates and top-performing content. This gives you a competitive edge, helping you see what’s working for them and apply those insights to your own strategies.
Social Media Dashboard Templates You Can Use (Free)
If you’re looking to get started with social media dashboards, there are plenty of free templates that offer a great foundation. These templates provide pre-set metrics and visualizations to help you track performance across various social platforms. Here are some popular options:
Facebook Ads Performance Overview
Facebook Ads Performance Overview: This template tracks key metrics like ad spend, impressions, clicks, and conversions. It’s designed to help you understand which ad campaigns are driving the best results, allowing you to optimize your ad strategy over time.
Instagram Business Profile Overview
This template focuses on metrics like engagement rates, follower growth, story views, and top-performing posts. It provides insights into how well your Instagram content resonates with your audience, making it easier to refine your strategy.
LinkedIn Company Pages Overview
For B2B marketers, this template tracks metrics like post reach, engagement rates, and follower demographics on LinkedIn. It’s useful for understanding the effectiveness of your LinkedIn content, including articles and updates, in driving professional engagement.
X (Twitter) Account Overview
This template allows you to monitor metrics such as tweet engagement, follower growth, retweets, and mentions. By focusing on these metrics, you can identify which types of content drive the most interaction.
TikTok Ads Engagement Overview
This template is designed to track TikTok ad performance, focusing on metrics like video views, likes, shares, and ad engagement rates. It’s helpful for understanding how well your TikTok campaigns resonate with users and how to enhance your ad strategy.
How to Customize Your Social Media Dashboard to Fit Your Needs
Creating a customized social media dashboard tailored to your business goals is essential for accurate performance tracking and strategic planning. Here’s how you can make the most of your dashboard setup:
- Tailoring Your Dashboard to Specific Business Goals and KPIs
The first step in customization is to define your goals clearly. Are you aiming to boost engagement, increase followers, drive traffic, or improve conversions? Once you know your goals, you can select the metrics that align with them. For example, if your primary goal is engagement, prioritize metrics like comments, shares, and likes. Tools like Competitors App allow you to customize KPIs, providing a more targeted view of both your and your competitors’ performance. - Adding Competitor Monitoring and Analysis with Competitors App
One of the standout features of Competitors App is its ability to integrate competitor analysis into your dashboard. You can add competitor tracking widgets that monitor their follower growth, engagement rates, and content performance. This enables you to compare your performance directly with others in your industry and quickly adapt your strategy based on competitive insights. - Custom Widgets and Features to Track Unique Metrics
Dashboards aren’t one-size-fits-all. Use custom widgets to display specific metrics that matter most to your business. For example, if you run a campaign-heavy strategy, set up widgets that track campaign-specific metrics like click-through rates (CTR) and conversions. Tools like Databox and Competitors App allow for widget customization, ensuring your dashboard matches your strategy. - Tips for Agency Dashboards: Client-Specific Customizations
For agencies managing multiple clients, setting up separate dashboards with client-specific KPIs is crucial. You can create dedicated views for each client, tailoring metrics based on their industry and goals. This not only provides clients with more relevant insights but also enhances your reporting by showcasing how their performance stacks up against competitors.
FAQs on Social Media Dashboards
What is a social media dashboard, and why is it important?
A social media dashboard is a tool that consolidates data from various social media platforms into one place, allowing businesses to monitor their performance metrics such as engagement, follower growth, and conversions. It helps streamline the process of tracking and analyzing social media efforts, ensuring that companies can make informed decisions based on real-time data.
What platforms can be monitored with a social media dashboard?
Most social media dashboards support platforms like Facebook, Instagram, LinkedIn, X (formerly Twitter), TikTok, and more. These tools enable users to track engagement, growth, and content performance across multiple accounts, all from a single interface.
How can I track competitors' social media performance with a free dashboard?
While most comprehensive tools require paid plans, free dashboards like Google Data Studio or integrating Competitors App’s free trial allow users to monitor basic competitor metrics. With these tools, you can track engagement rates, post frequency, and follower growth, giving you valuable insights into your competitors’ strategies.
Can I use a social media dashboard for free?
Yes, there are several free tools available, such as Google Data Studio, which allows users to create customized dashboards by integrating data from multiple social media platforms. Many paid tools, like Competitors App, offer free trials or basic plans that provide limited functionality but are still helpful for tracking essential metrics like engagement and follower growth.
What metrics should I prioritize in my social media dashboard?
The most important metrics depend on your goals. Typically, you’ll want to track engagement (likes, shares, comments), follower growth, traffic driven from social media to your website, and conversions (sales, sign-ups, etc.). If you’re focusing on brand awareness, tracking reach and impressions may be crucial. Tools like Competitors App can also help monitor competitor performance metrics.
How often should I review my social media dashboard?
For real-time insights and fast response to trends, it’s best to review your dashboard daily or weekly. Automated reporting features make this easier by providing regular updates without manual input. This frequency ensures you can adjust your content strategy quickly in response to performance data.
Can I monitor multiple businesses or clients with a single social media dashboard?
Yes, most dashboards, including Competitors App and Google Data Studio, allow you to set up different views for multiple accounts or clients. This feature is especially useful for agencies managing multiple brands, as you can customize dashboards for each client’s KPIs and competitors, ensuring tailored reporting for each one.