
Introduction to Amplitude and Looker in Analytics Tools
Amplitude and Looker are two prominent names in the analytics tools landscape, each serving distinct yet overlapping purposes for businesses seeking to harness data for informed decision-making.
Main Purposes:
- Amplitude specializes in product analytics, providing insights into user behavior and engagement metrics, enabling businesses to optimize their product offerings.
- Looker, on the other hand, focuses on business intelligence and data visualization, helping organizations analyze data from multiple sources to gain strategic insights.
Common User Considerations: Both tools are favored by businesses looking to make data-driven decisions. Users often evaluate them for their capabilities in transforming complex data into actionable insights, thus driving growth and improving user experiences.
Primary Comparison Aspects
-
Features:
- Amplitude excels in user-centric analytics, offering tools for cohort analysis, retention tracking, and conversion funnels.
- Looker provides robust data modeling, dashboards, and visualization capabilities, making it easier to create comprehensive reports from diverse datasets.
-
Pricing:
- Amplitude typically employs a usage-based pricing model that adjusts with user organization needs, which can be ideal for startups and scaling enterprises.
- Looker’s pricing is generally subscription-based and often reflects the scale of data processing and user access required, appealing to larger organizations needing extensive BI.
-
Ease of Use:
- Amplitude is recognized for its user-friendly interface designed for product teams, facilitating intuitive navigation even for those with limited analytical expertise.
- Looker, while powerful, may have a steeper learning curve given its advanced data modeling and SQL-based querying capabilities, requiring some level of technical knowledge.
This comparison aims to guide users in selecting the right tool based on their specific analytics needs and business objectives.
Amplitude VS Looker: Which tool is the most popular?
| Tool | Number of Reviews | Average Rating | Positive Reviews | Neutral Reviews | Negative Reviews |
|---|---|---|---|---|---|
| Looker | 20 | 4.5 | 19 | 1 | 0 |
| Amplitude | 32 | 3.17 | 19 | 2 | 11 |
Looker is the most popular tool based on average user ratings, with a significantly higher rating of 4.5 from 20 reviews. Amplitude, while having the highest number of reviews at 32, has a much lower average rating of 3.17. The positive review count for both tools is equal at 19, but Looker has no negative reviews, compared to Amplitude’s 11 negative reviews.

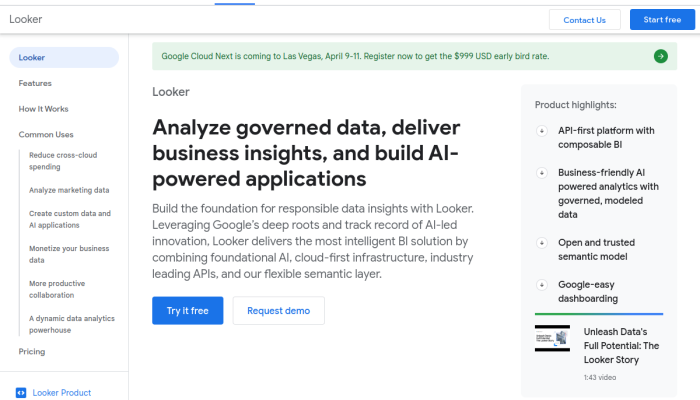
Amplitude and Looker: Quick Comparison Overview
| Feature | Ahrefs | SEMrush |
|---|---|---|
| Primary Features | – Site Explorer | – Domain Overview |
| – Keyword Explorer | – Keyword Research | |
| – Content Explorer | – Site Audit | |
| – Rank Tracker | – Backlink Analytics | |
| – Site Audit | – Social Media Tools | |
| – Clustering Tool | – Advertising Research | |
| – Backlink Checker | – Organic Research | |
| Target Audience | – SEO professionals | – Marketers & Advertising Specialists |
| – Content marketers | – Small to large businesses | |
| – Agencies | – E-commerce sites | |
| – Bloggers | – Content creators | |
| Main Advantages | – Rich backlink database | – Comprehensive all-in-one tool |
| – Strong focus on SEO tools | – Extensive keyword database | |
| – User-friendly interface | – Great competitor analysis | |
| – Excellent for site audits | – Versatile reporting features | |
| – Strong tracking capabilities | – Advanced PPC research | |
| Core Value Proposition | Detailed SEO analysis and backlink profile tracking, ideal for optimizing website visibility. | A complete digital marketing suite that covers SEO, PPC, and social media analytics for comprehensive strategy development. |
| Ideal Use Cases | – Analyzing competitor backlinks | – Running multi-channel digital marketing campaigns |
| – Finding keyword opportunities | – Tracking pay-per-click strategies | |
| – Performing in-depth site audits | – Monitoring social media performance | |
| – Crafting content strategies based on SEO data | – Conducting market research and analysis |
Most liked vs most disliked features of Amplitude and Looker
| Tool | Most Liked Features | Most Disliked Features |
|---|---|---|
| Amplitude | – Overall user experience is highly rated as amazing and user-friendly. – Extensive free plan enables small businesses to access powerful analytics tools. – Deep analytical capabilities aid in understanding user behavior and product usage. – Reliable and helpful customer service enhances user satisfaction. – Regular updates and improvements benefit evolving analytics needs. |
– Issues with moving data in and out of the platform. – Advanced features can be overwhelming for non-analysts despite user-friendliness. – Ambiguity in pricing structures across different tiers. – Limited customer support access for users on cheaper subscription plans. – Dashboard customization options are somewhat limited. |
| Looker | – Simple navigation and report creation enhance accessibility for all users. – Effective tools create clear and informative dashboards. – Seamless integration with Google tools boosts workflow efficiency. – Dashboards and reports can be tailored to specific needs. – Automatic data importing ensures up-to-date reporting for timely business decisions. |
– New users might struggle with platform navigation. – Lag or freezing issues can hinder productivity with complex datasets. – Limited data transformation capabilities restrict manipulation before visualization. – Some interface elements may appear simplistic and lack advanced features compared to competitors. – Time-consuming and challenging data source setup. |
Key Features of Amplitude vs Looker
Sure! Here is a breakdown of the key features of Amplitude and Looker as analytics tools, along with descriptions of how each feature benefits users and any unique aspects of each brand.
Amplitude
-
Product Analytics:
- Feature: Amplitude provides powerful tools to track user interactions with digital products, helping businesses understand how users engage with their apps and websites.
- Benefit: This allows teams to identify which features drive user retention and conversion, enabling data-driven product decisions.
-
User Segmentation:
- Feature: Amplitude allows users to create dynamic segments based on various criteria, such as behavior, demographics, and acquisition channels.
- Benefit: This granular user segmentation helps businesses tailor personalized experiences and marketing campaigns.
-
Cohort Analysis:
- Feature: Users can analyze cohorts that share common behaviors over time.
- Benefit: This enables businesses to see how different user groups respond to changes, enhancing retention strategies.
-
Event Tracking:
- Feature: Amplitude enables detailed event tracking, providing insights into specific actions users take within the product.
- Benefit: By understanding event-level behavior, teams can optimize the user journey and identify potential pain points.
-
Funnels:
- Feature: Amplitude’s funnel analysis visualizes the user journey, showing how users move through defined steps toward a conversion goal.
- Benefit: This helps identify drop-off points and optimize user flows to improve conversion rates.
-
Retention Analysis:
- Feature: Amplitude offers tools for tracking user retention over time, allowing businesses to see how well they keep users engaged.
- Benefit: Knowing retention metrics helps teams make informed decisions to enhance user engagement strategies.
-
Dashboard and Reporting:
- Feature: Amplitude provides customizable dashboards that visualize key metrics and insights.
- Benefit: This customizable reporting helps business stakeholders quickly grasp important data without needing extensive data analysis skills.
-
Integrations and APIs:
- Feature: Amplitude supports a wide range of integrations and offers APIs for easy data import/export.
- Benefit: Seamless integration with other tools and platforms allows businesses to enhance their data ecosystem.
Unique Aspects of Amplitude:
- Amplitude’s focus on product analytics differentiates it from general analytics tools, making it particularly beneficial for product teams.
- It offers advanced features like behavioral cohorts, which are often more sophisticated than those found in competitor platforms.
Looker
-
Data Modeling:
- Feature: Looker uses a modeling language called LookML, allowing for the definition of relationships within the data.
- Benefit: This provides users with a centralized way to manage business logic and data relationships, ensuring consistency across analyses.
-
Customizable Dashboards:
- Feature: Users can create highly customizable and interactive dashboards that reflect their analytical needs.
- Benefit: The flexibility of Looker dashboards makes it easy for teams to visualize data in a meaningful way, tailored to specific business needs.
-
Explorable Reports:
- Feature: Looker enables the creation of interactive reports that users can explore with filters and pivots.
- Benefit: This interactivity empowers users to access deeper insights without needing help from data teams.
-
Embedded Analytics:
- Feature: Looker can embed reports and dashboards into external applications.
- Benefit: This facilitates the delivery of insights directly within business applications, enhancing decision-making processes.
-
Data Governance:
- Feature: Looker emphasizes data governance, ensuring that all users are referencing the same metrics and definitions.
- Benefit: This alignment promotes trust in the data across the organization and reduces discrepancies in reporting.
-
Scheduled Reports and Alerts:
- Feature: Users can schedule reports and set alerts for specific metrics.
- Benefit: This automation keeps stakeholders informed in real-time and helps in proactive decision-making.
-
Collaboration Features:
- Feature: Looker offers collaboration tools that allow users to share insights and discussions directly within the platform.
- Benefit: This enhances teamwork, making it easier for teams to work together on data-driven insights.
-
Integration with Cloud Data Warehouses:
- Feature: Looker seamlessly integrates with various cloud data warehouses like BigQuery, Snowflake, and Redshift.
- Benefit: This allows organizations to leverage existing data infrastructures easily.
Unique Aspects of Looker:
- Looker’s LookML provides a unique way to model complex data in a scalable manner, which can be a major advantage for companies with intricate data needs.
- Its emphasis on data governance ensures that all team members operate from a single source of truth, enhancing data-driven decision-making.
Overall, both Amplitude and Looker offer unique features that cater to different analytics needs. While Amplitude focuses extensively on product analytics and user interactions, Looker excels in data modeling and governance, making each tool suitable for specific types of analytics challenges.
Amplitude vs Looker Pricing Comparison
| Feature/Brand | Amplitude Pricing | Looker Pricing |
|---|---|---|
| Free Trial | 30-day free trial available | 14-day free trial available |
| Starter Tier | $0/month | Pricing not publicly available |
| Core Tier | $995/month (billed annually) | Pricing not publicly available |
| Growth Tier | Custom pricing (contact for details) | Custom pricing (contact for details) |
| Enterprise Tier | Custom pricing (contact for details) | Custom pricing (contact for details) |
| User Metrics | Unlimited users | Limited users (exact number varies) |
| Data Sources | Integrations with multiple sources | Integrations with multiple sources |
| Access Level | Self-serve analytics | Business intelligence capabilities |
| Support | Email support included | Email and phone support available |
| Key Features | Event tracking, user behavior analysis | Data exploration, custom dashboards |
Main Differences in Offerings:
- User Metrics: Amplitude allows for unlimited users across its tiers, while Looker restricts users based on tier or custom contract.
- Support: Looker provides both email and phone support, which may be more comprehensive than Amplitude’s email-only support at lower tiers.
- Feature Set: Amplitude emphasizes self-serve analytics focused on user behavior and event tracking, whereas Looker offers robust business intelligence capabilities with a focus on data exploration and dashboard customization.
- Free Trial Duration: Amplitude offers a longer free trial compared to Looker.
Discounts:
- Amplitude typically does not offer discounts beyond the free trial, while Looker’s pricing page does not disclose specific discounts but often negotiates with enterprises for bulk pricing or extended commitments.
Support Options Comparison: Amplitude vs Looker
| Support Option | Amplitude | Looker |
|---|---|---|
| Live Chat | Available during business hours for all users. | Available during business hours for all users, specifically for customers on higher-tier plans. |
| Phone Support | Not available for all users; limited to higher-tier plans. | Available for higher-tier customers, with dedicated account managers for personalized support. |
| Documentation | Extensive knowledge base with articles covering setup, usage, and troubleshooting. | Comprehensive documentation with guides on using Looker, API references, and troubleshooting tips. |
| Webinars | Regularly scheduled webinars covering product features and best practices, accessible for users at all levels. | Offers webinars focusing on product updates and usage tutorials, primarily aimed at customers. |
| Tutorials | Provides tutorials and walkthroughs, including video content. | Includes tutorials integrated into the documentation, with step-by-step instructions for various use cases. |
Unique Features of Amplitude Vs Looker
| Feature | Amplitude | Looker | Added Value | Decision Factors |
|---|---|---|---|---|
| Behavioral Cohorting | Allows detailed segmentation based on user behavior | N/A | Enables businesses to tailor marketing strategies and product development to specific user groups. | Businesses aiming for personalized user experiences may find this indispensable for optimizing engagement and retention. |
| Cross-Platform Tracking | Provides insights across different platforms and devices | N/A | Offers a holistic view of user interactions across touchpoints, ensuring comprehensive analysis. | Companies with diverse user bases spanning multiple platforms benefit significantly for unified analysis. |
| User Path Analysis | Visualizes user navigation paths through applications | N/A | Facilitates understanding of user journeys and helps identify drop-offs or potential improvements. | Understanding user flow can be crucial for UX/UI design adjustments leading to better conversions. |
| Real-Time Data Processing | Processes data in real-time for immediate insights | N/A | Enables organizations to react swiftly to user behavior, driving timely decision-making. | Companies requiring rapid adjustments to marketing campaigns or product features can leverage this for competitive advantage. |
| Adoption Tracking | Monitors feature adoption rates over time | N/A | Assists teams in evaluating the performance of newly launched features or changes. | Product managers can focus on enhancements that drive usage, ensuring features resonate with users. |
| LookML | A unique modeling language to define data relationships | N/A | Simplifies data model design and promotes reusability across reports. | Looker’s LookML empowers analytics teams to develop and maintain complex data structures efficiently. |
| Built-In Data Governance | Ensures consistent data use and access controls | N/A | Enhances data security and establishes trust across stakeholders. | Organizations prioritizing data integrity and compliance will find this feature paramount for operational efficiency. |
| Custom Data Visualizations | Extensive customization options for data representation | N/A | Empowers users to create tailored visual insights that cater to specific business needs. | Businesses requiring precise storytelling through data will be able to communicate insights effectively to stakeholders. |
| Embedded Analytics | Allows integration of analytics directly into products | N/A | Drives enhanced user engagement and product efficacy through in-app insights. | Platforms wanting seamless user experiences can capitalize on embedding analytics, leading to higher satisfaction and retention rates. |
| Interactive Dashboards | Provides dynamic and drill-down capabilities in dashboards | N/A | Users can explore their data further rather than relying solely on static reports. | Companies seeking in-depth analytics across KPIs will find this feature vital for informed decision-making. |
Amplitude offers unique features that emphasize user behavior analysis and real-time insights, while Looker’s strength lies in its modeling and visualization capabilities. The added value of these features can significantly influence a business’s decision to select one platform over another, depending on their specific analytical needs and overall strategic goals.

