
Kissmetrics and Looker are two well-regarded tools in the realm of analytics, each catering to different needs within data analysis and business intelligence.
Main Purposes:
- Kissmetrics focuses on customer analytics, enabling businesses to track user behavior, conversion rates, and customer journeys. It helps organizations identify valuable metrics related to individual users and cohorts.
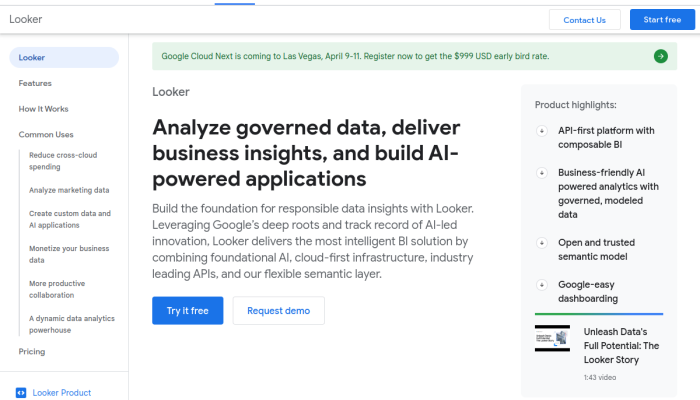
- Looker, on the other hand, is a comprehensive business intelligence tool that allows organizations to analyze data across various sources, create interactive dashboards, and derive insights for better decision-making.
Common Considerations for Users: Users often consider Kissmetrics for its specialization in user-level analytics, particularly for marketing teams aiming to increase conversions. Looker is favored by businesses seeking a robust platform that can integrate with various data sources and provide a broader scope of analytics capabilities.
Primary Comparison Aspects:
- Features: Kissmetrics offers strong customer tracking features, while Looker excels in data modeling, integration, and reporting capabilities.
- Pricing: Pricing structures vary significantly, with Kissmetrics typically offering subscription models based on user volume, while Looker’s pricing is often tailored per organization depending on their data complexity and needs.
- Ease of Use: Kissmetrics aims for simplicity with a user-friendly interface, making it accessible for marketing teams. Looker, while providing more complex functionalities, requires a steeper learning curve due to its extensive feature set.
Understanding these key differences can guide users in selecting the appropriate tool that aligns with their analytics needs and business objectives.
Kissmetrics VS Looker: Which tool is the most popular?
| Tool | Number of Reviews | Average User Rating | Positive Reviews | Neutral Reviews | Negative Reviews |
|---|---|---|---|---|---|
| Kissmetrics | 20 | 4.55 | 19 | 0 | 1 |
| Looker | 20 | 4.5 | 19 | 1 | 0 |
Kissmetrics and Looker both received an equal number of reviews, totaling 20 each. Kissmetrics achieved a slightly higher average user rating of 4.55, compared to Looker’s 4.5. Both tools received a strong majority of positive reviews, with Kissmetrics having one negative review and Looker none. Based on the average user rating, Kissmetrics is the more popular tool, while Looker, although equally reviewed, has a slightly lower rating and a neutral feedback entry, indicating a lesser preference among users.

Kissmetrics and Looker: Quick Comparison Overview
| Feature | Ahrefs | SEMrush |
|---|---|---|
| Primary Features | – Site Explorer | – Domain Overview |
| – Keyword Explorer | – Keyword Research | |
| – Content Explorer | – Site Audit | |
| – Rank Tracker | – Backlink Analytics | |
| – Site Audit | – Social Media Tools | |
| – Clustering Tool | – Advertising Research | |
| – Backlink Checker | – Organic Research | |
| Target Audience | – SEO professionals | – Marketers & Advertising Specialists |
| – Content marketers | – Small to large businesses | |
| – Agencies | – E-commerce sites | |
| – Bloggers | – Content creators | |
| Main Advantages | – Rich backlink database | – Comprehensive all-in-one tool |
| – Strong focus on SEO tools | – Extensive keyword database | |
| – User-friendly interface | – Great competitor analysis | |
| – Excellent for site audits | – Versatile reporting features | |
| – Strong tracking capabilities | – Advanced PPC research | |
| Core Value Proposition | Detailed SEO analysis and backlink profile tracking, ideal for optimizing website visibility. | A complete digital marketing suite that covers SEO, PPC, and social media analytics for comprehensive strategy development. |
| Ideal Use Cases | – Analyzing competitor backlinks | – Running multi-channel digital marketing campaigns |
| – Finding keyword opportunities | – Tracking pay-per-click strategies | |
| – Performing in-depth site audits | – Monitoring social media performance | |
| – Crafting content strategies based on SEO data | – Conducting market research and analysis |
Most liked vs most disliked features of Kissmetrics and Looker
| Tool | Most Liked Features | Most Disliked Features |
|---|---|---|
| Kissmetrics | – Ability to track user interactions effectively, including purchases and drop-off points in the sales funnel. | – Aesthetic design of the admin tool faces criticism. |
| – Aids in making data-driven decisions regarding website conversions and user behavior analysis. | – Complex installation process can be time-consuming for new users. | |
| – Generally user-friendly interface, making report creation and analytics straightforward. | – Difficulties in setting up team sharing features affecting collaboration. | |
| – Easy to implement with just a simple JavaScript code and accessible from any location. | – Concerns regarding pricing structure, suggesting a need for a lower-priced option for better accessibility. | |
| – Exceptional customer support with demos and assistance offered to help users understand functionalities. | – Suggestions for advanced features to enhance competitiveness with other analytics tools. | |
| Looker | – Simplifies navigation and report creation for enhanced user accessibility. | – New users may find navigation challenging, making full utilization daunting. |
| – Effective tools for creating clear and informative dashboards to convey data insights. | – Reports of lags or freezing when dealing with complex datasets can hinder productivity. | |
| – Seamless integration with Google tools streamlines data flow and workflow efficiency. | – Lack of robust data transformation capabilities limits data manipulation before visualization. | |
| – Customizable dashboards and reports to meet specific needs and client requirements. | – Some interface elements perceived as simplistic and lacking advanced features compared to competitors. | |
| – Automatic data importing ensures up-to-date reporting to aid timely business decisions. | – Setting up and connecting data sources can be time-consuming and not straightforward. |
Key Features of Kissmetrics vs Looker
Here’s a comparison of the key features of Kissmetrics and Looker, two popular analytics tools, along with a description of how each feature benefits users and any unique aspects of each platform.
Kissmetrics
1. Funnel Reports
- Benefits: Users can visualize how customers move through their sales funnels, identifying bottlenecks or drop-off points.
- Unique Aspect: Kissmetrics emphasizes tracking individual user behavior over time, allowing for a more personalized understanding of user journeys.
2. Cohort Analysis
- Benefits: Users can segment their customers into cohorts based on shared characteristics, making it easier to analyze retention and engagement.
- Unique Aspect: This feature is geared towards helping marketers understand long-term trends and the lifetime value of customers.
3. Customer Tracking
- Benefits: Kissmetrics tracks individual user actions across sessions, providing insights into the behavior and preferences of specific users.
- Unique Aspect: This level of tracking can inform tailored marketing campaigns and improve customer engagement.
4. A/B Testing
- Benefits: Users can conduct experiments to determine which versions of a page or element yield the best conversion rates.
- Unique Aspect: Kissmetrics integrates A/B testing with funnel analysis, helping users understand the impact of changes on both drop-off rates and conversion outcomes.
5. Revenue Tracking
- Benefits: Users can monitor revenue generated from different channels, campaigns, or customer segments to understand their financial performance better.
- Unique Aspect: This feature ties marketing efforts directly to revenue, supporting a clear ROI analysis.
6. Retention Reports
- Benefits: Users can evaluate user retention over time and identify segments or strategies that keep users engaged.
- Unique Aspect: Kissmetrics provides specific metrics to gauge customer loyalty, helping businesses to refine their customer experience.
Looker
1. Data Visualizations
- Benefits: Looker allows users to create customizable dashboards and visualizations, helping to represent complex data in an understandable format.
- Unique Aspect: Its emphasis on interactive visualizations helps users drill down into data, offering deeper insights.
2. Embedded Analytics
- Benefits: Users can embed Looker’s analytics directly into their applications, providing insights in contextual environments.
- Unique Aspect: Looker’s ability to integrate seamlessly with other platforms enhances user experience and accessibility of data analytics.
3. Data Governance
- Benefits: Looker includes features for managing access to data and ensuring consistency across various reports and analyses.
- Unique Aspect: Strong data governance helps large organizations maintain control over data usage and quality.
4. LookML Modeling Language
- Benefits: Users can easily define relationships in their data and create reusable metrics and dimensions using LookML.
- Unique Aspect: LookML allows for the democratization of data analytics, enabling non-technical users to work effectively with data.
5. Real-Time Analytics
- Benefits: Looker provides real-time insights, enabling businesses to make timely, informed decisions.
- Unique Aspect: This feature is vital for organizations needing to react quickly to changing market conditions.
6. API Access
- Benefits: Looker offers APIs that allow users to access and manipulate data programmatically.
- Unique Aspect: Extensive API capabilities facilitate custom integrations and automation, catering to a variety of tech-savvy users.
Summary
Both Kissmetrics and Looker offer powerful analytics tools, but they cater to different needs. Kissmetrics is particularly focused on understanding user behavior and optimizing customer journeys, great for marketers looking to enhance customer engagement and retention. In contrast, Looker excels in providing comprehensive data visualizations, governance, and real-time analytics, making it suitable for data-driven organizations seeking to integrate and democratize analytics across teams. Each tool has its distinct features that offer unique benefits to its users, enriching their strategic decision-making processes.
Kissmetrics vs Looker Pricing Comparison
| Feature/Brand | Kissmetrics Pricing | Looker Pricing |
|---|---|---|
| Pricing Tiers | – Essential – Growth – Premium |
– Standard – Advanced |
| Monthly Subscription | – Essential: $299 – Growth: $499 – Premium: Custom pricing |
– Standard: Varies based on usage – Advanced: Varies based on usage |
| Annual Subscription | – Essential: $3,588 ($299/month) – Growth: $5,988 ($499/month) – Premium: Custom pricing |
– Standard: Varies based on usage (annual discounts not specified) – Advanced: Varies based on usage (annual discounts not specified) |
| User Limit | – Essential: Up to 1 user – Growth: Up to 5 users – Premium: Custom users |
– Standard: Depends on package – Advanced: Depends on package |
| Features Included | – Essential: Basic analytics features, Retention reports, Mobile view – Growth: All Essential features + Funnel reports, A/B testing, Webhooks – Premium: All Growth features + Custom data integration, Dedicated support |
– Standard: Basic analytics & dashboard features, Data exploration, Alerts – Advanced: All Standard features + Data modeling, Advanced analytics, API access |
| Free Trial | – No free trial offered | – Free 14-day trial available |
| Special Rates | – None specified | – Pricing based on annual commitment and usage may vary |
| Target Market | – Focus on startups and small to medium businesses | – Targets enterprises looking for advanced data integration and analysis capabilities |
Kissmetrics offers fixed pricing tiers that cater towards different levels of user access and analytics features, whereas Looker employs a more flexible pricing model based on usage, particularly attractive for larger organizations or enterprises.
Support Options Comparison: Kissmetrics vs Looker
| Support Feature | Kissmetrics | Looker |
|---|---|---|
| Live Chat | Available during business hours. | Available as part of premium support. |
| Phone Support | No phone support offered. | Phone support available for premium plans. |
| Documentation | Comprehensive help center with articles. | Extensive documentation with guides and API references. |
| Additional Resources | Webinars and tutorial videos available. | Offers webinars, training sessions, and community forums. |
Kissmetrics focuses on self-service support through a robust help center, whereas Looker provides more personalized assistance through phone support for premium users, along with a wealth of documentation and additional training resources.
Unique Features of Kissmetrics Vs Looker
| Brand | Unique Features | Added Value | Potential Deciding Factors |
|---|---|---|---|
| Kissmetrics | Cohort Analysis | Allows users to track specific groups over time, providing insights into customer behavior and retention. | Businesses focused on customer retention and lifecycle marketing will find this feature invaluable for long-term strategy. |
| Funnel Reports | Visual representation of user paths through the conversion process helps to identify drop-off points. | Helps teams optimize the customer journey, focusing on improving conversion rates where it matters most. | |
| Customer Tracking | Unique ability to tie metrics to individual customers, enabling personalized marketing efforts. | Facilitates targeted campaigns that resonate with specific audience segments, increasing engagement and conversion. | |
| Revenue Reporting | Tracks revenue attribution by associating income directly with marketing efforts and customer interactions. | Provides clear ROI for marketing efforts, allowing better budget allocation based on performance. | |
| Looker | Data Modeling | Allows users to create custom models to define how data should relate, providing flexibility in data analysis. | Empowers businesses to tailor analyses to their unique needs, ensuring relevant insights without heavy reliance on IT. |
| LookML Language | A proprietary language for data modeling that enhances data consistency and reusability. | Streamlines collaboration across teams by establishing a common framework for data definitions, reducing miscommunication. | |
| Embedded Analytics | Provides capabilities for integrating analytics features directly into other applications or websites. | Enhances user experience by bringing data insights directly to the point of action, driving informed decision-making where it counts. | |
| Real-time Dashboarding | Offers the ability to create live data dashboards that update in real-time for immediate insights. | Facilitates quick response to business changes by keeping teams informed with the latest data trends. |

